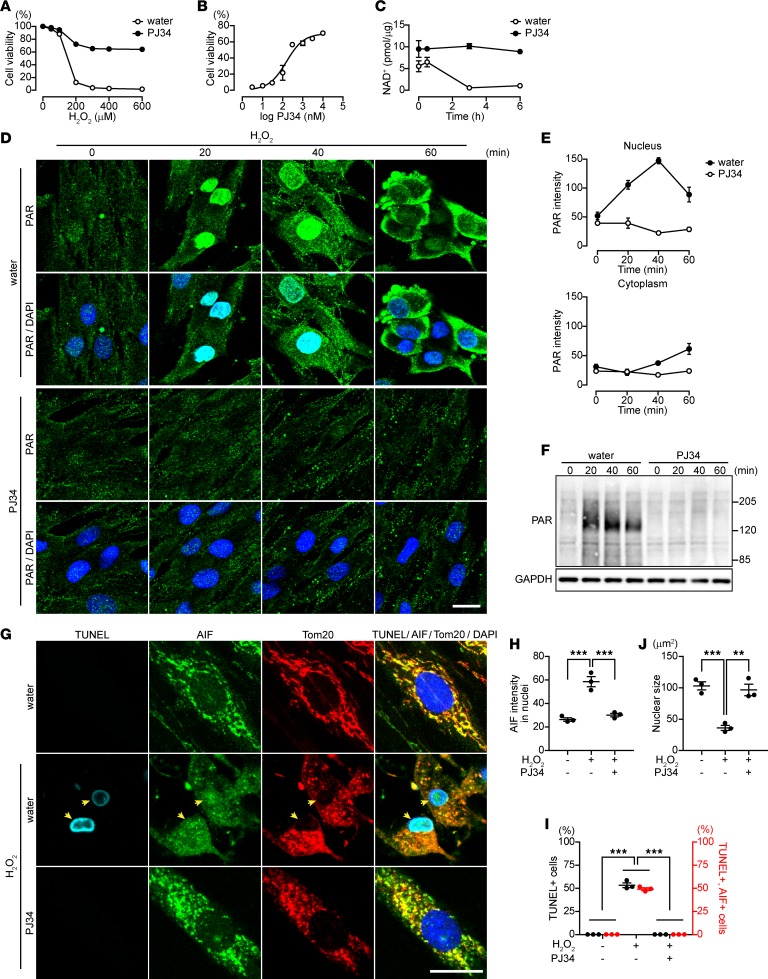
Figure 2. PJ34 inhibits H2O2-induced PAR accumulation and AIF-mediated DNA fragmentation in patient fibroblasts.
(A) H2O2-induced cytotoxicity in patient fibroblasts (PJ34, 10 μM). Data are mean ± SEM of values obtained from 3 experiments conducted in triplicate. Significant differences were observed with 200 μM. (B) Concentration-dependent effect of PJ34 on H2O2-induced cytotoxicity (H2O2, 300 μM). Data represent mean ± SEM of values obtained from 3 experiments conducted in triplicate and were fitted to a sigmoidal (variable slope) curve. IC50= 158.2 ± 3.21 nM. (C) Effect of PARP activation on NAD+ content. NAD+ concentration (pmol/μg) was measured by HPLC and normalized to protein concentration. Data are mean ± SEM of values obtained from 3 experiments. Significant differences were observed at all time points. (D) Effect of PJ34 on time-dependent PAR localization following exposure to H2O2 (300 μM) in patient fibroblasts. DAPI was used as a nuclear marker. (E) Mean PAR fluorescence intensities in nuclei and cytoplasm following exposure to H2O2. Data are mean ± SEM of values obtained from 30–60 cells from three samples. Significant differences in the nucleus and cytoplasm were observed at 20 min and 40 min, respectively. (F) Effect of PJ34 on H2O2-induced PAR accumulation. These representative data were replicated three times with similar results. (G) Effect of PJ34 on AIF translocation to nuclei and DNA fragmentation. After a 16-hour exposure to 300 μM H2O2 without or with PJ34, patient fibroblasts were subjected to TUNEL assay (light blue), DAPI (blue), and immunolabeling with anti-AIF (green) and anti-Tom20 (marker for mitochondria, red) antibodies. Arrowheads indicate nuclei (blue) with DNA fragmentation that are colocalized with AIF. Scale bar: 20 μm (D and G). (H) Nuclear localization of AIF. Data are mean ± SEM of values obtained from 76–164 cells from 3 samples. ***P < 0.001. (I) Percentage of patient fibroblasts with chromatin condensation and AIF translocation to nuclei. Data are mean ± SEM of values obtained from 97–174 cells in 3 samples. ***P < 0.001. (J) Mean nuclear size assessed by DAPI. Data are mean ± SEM of values obtained from 59–221 cells from 3 samples. **P < 0.01, ***P < 0.001, two-way ANOVA with Bonferroni’s post-hoc test (A, C, E, H–J).

