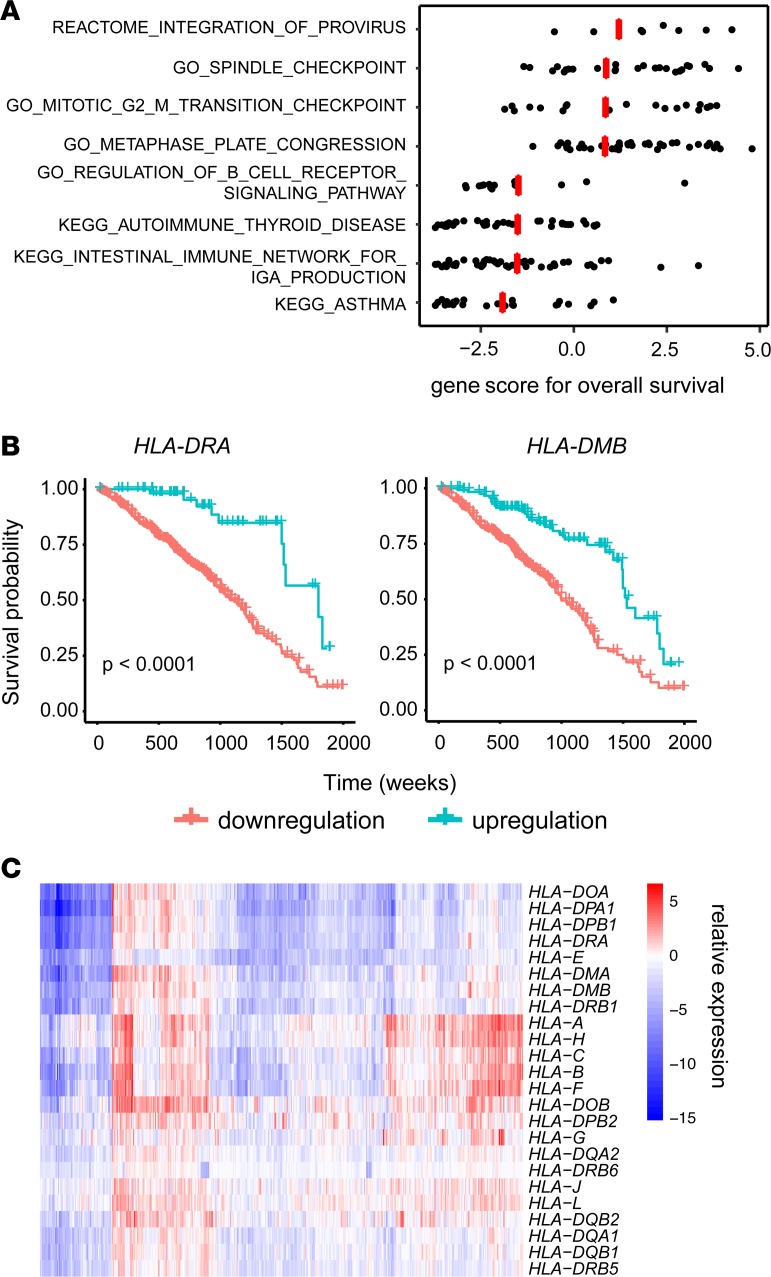
Figure 1. Cell cycle genes and MHCII genes are potential prognostic predictors of LUAD.
(A) Gene set analysis of TCGA LUAD data to determine the significance of curated canonical pathways with respect to overall patient survival. Each dot represents the individual gene score within the corresponding pathway, and each red line is the score for the gene set calculated from R package GSA. (B) Kaplan-Meier plot showing the 5-year overall survival with respect to HLA-DRA and HLA-DMB expressions for patients in TCGA LUAD cohorts. Log-rank test was performed to determine significance. (C) Heatmap of the relative expression of MHC genes in tumor tissues compared with matched normal tissues for TCGA LUAD data.

