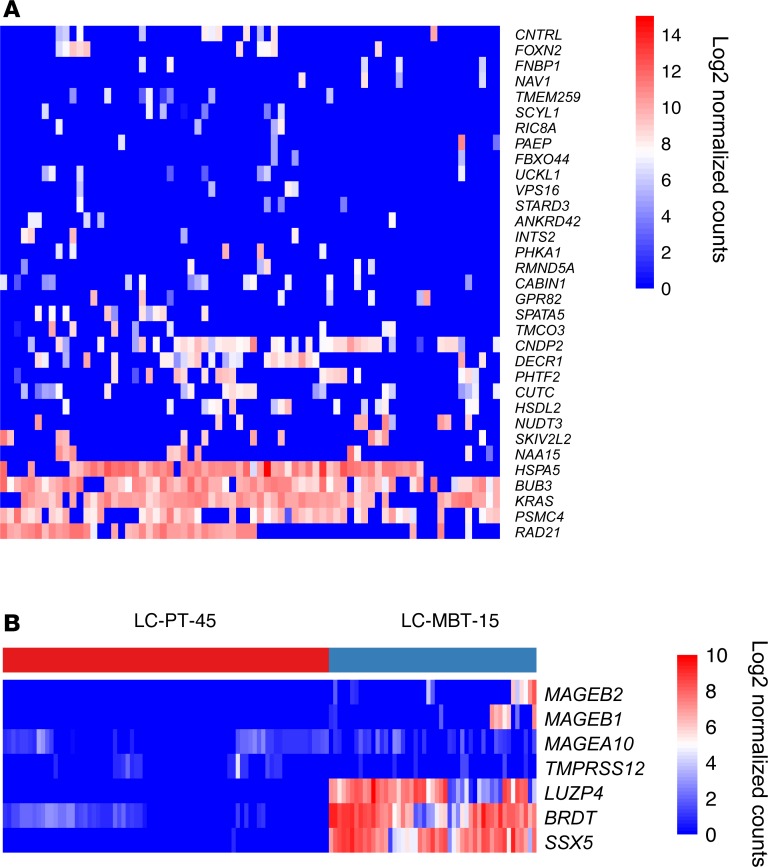
Figure 4. Heterogeneous expression of neoantigens and CTAs in single cancer cells.
(A) Heatmap showing the expression of neoantigens in single cells from LC-PT-45. Log2 normalized counts of 0 represent either no expression or no somatic mutation was detected. Cells were included if a neoantigen was detected regardless of its corresponding wild-type antigen detection status. Only neoantigens detected in more than 3 cells were selected. (B) Heatmap showing the expression of CTAs in single cells from LC-PT-45 and LC-MBT-15. CTAs whose expressions were transcriptionally silent in normal nongermline tissues based on GTEx data and with normalized counts greater than 0 in more than 2 cells were selected.

