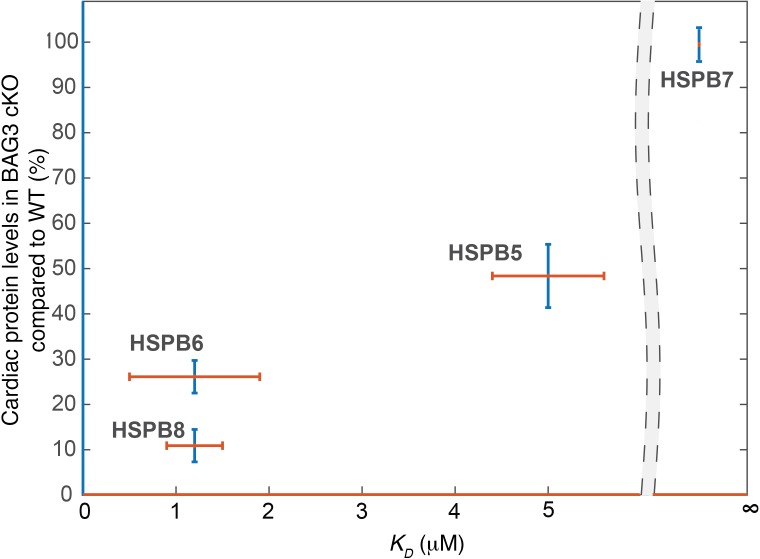
Figure 2. Reduction of cardiac sHSP levels in BAG3-cKO mice correlates with their affinity for BAG3.
The x axis (red lines) shows the dissociation constant (KD) between sHSP and BAG3. A lower KD value indicates a stronger interaction between the respective sHSP and BAG3. KD values between sHSP and BAG3 were obtained from Raush et al. (23), and Vos et al. (27) reported the absence of affinity (infinite KD) between HSPB7 and BAG3. The y axis (blue lines) shows cardiac levels of sHSP protein in BAG3-cKO mice relative to WT mice. Cardiac levels of sHSPs in BAG3-cKO mice were obtained from Fang et al. (28). Infinite KD indicates no binding.

