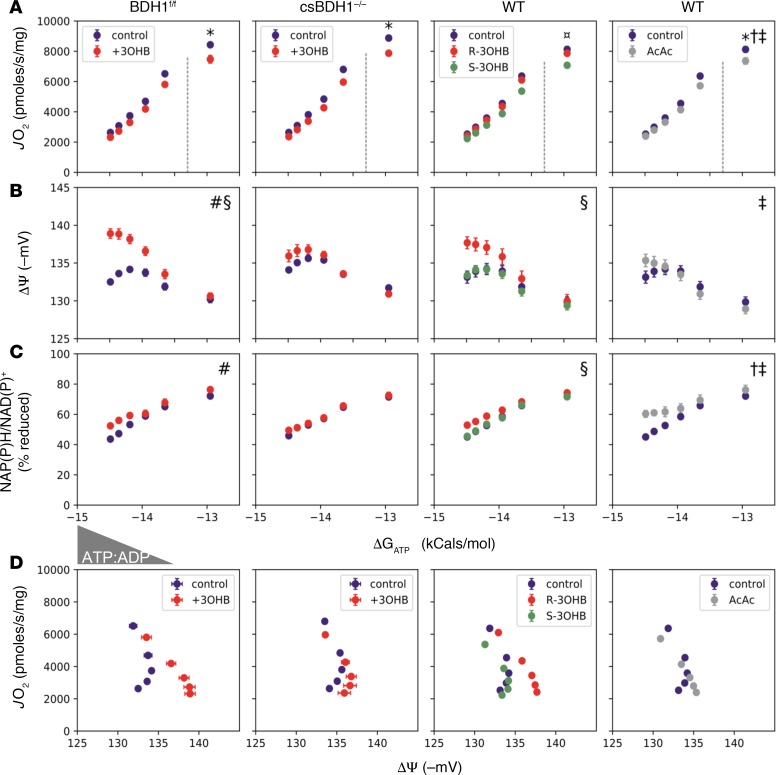
Figure 7. The effects of 3OHB on mitochondrial respiratory efficiency depend on BDH1 flux.
(A–C) Freshly isolated mitochondria from heart ventricles of BDH1fl/fl (controls), csBDH1–/–, or WT C57BL/6N mice were used to assess the impact of 3OHB on the relationship between (A) oxygen consumption rate (JO2), (B) membrane potential (ΔΨ ) in millivolts (mV), and (C) NAD(P)H/NAD(P)+ redox state versus the estimated Gibbs energy of ATP hydrolysis (ΔGATP). Mitochondria were fueled with pyruvate + malate (110 μM each) and 50 μM L-octanoylcarnitine in the absence (purple) or presence of 2 mM of the (R, red) or (S, green) enantiomer of 3OHB, or acetoacetate (AcAc, gray). (D) Mitochondrial respiratory efficiency was evaluated by plotting JO2 against ΔΨ. Dotted lines separate the submaximal and maximal portions of JO2 vs. ΔGATP. Triangle denotes the changing concentrations of ATP relative to ADP (ATP:ADP), resulting in a reciprocal change in energy demand. Data represent mean ± SEM (n = 4–6). Comparisons between BDH1fl/fl versus csBDH1–/– mitochondria were analyzed by 3-way ANOVA followed by Tukey HSD (#ketone/genotype interaction; §ketone effect; P< 0.05 and family-wise error rate [FWER] < 0.05) using measurements (A–C) made at submaximal JO2. Energy fluxes representing maximal JO2 (ΔGATP = –12.95) were analyzed by 2-way ANOVA and Tukey HSD (*FWER < 0.05, relative to vehicle control). Comparison of R and S enantiomers were analyzed by 2-way ANOVA (submaximal JO2) and 1-way ANOVA (maximal JO2) each followed by Tukey HSD (§effect of R at submaximal JO2; ¤effect of S at maximal JO2; FWER < 0.05). Effects of AcAc were analyzed by 2-way ANOVA at submaximal JO2 (†main effect of ketone; ‡ketone/ΔGATP interaction, P < 0.05) and t test at maximal JO2 (*P < 0.05).

