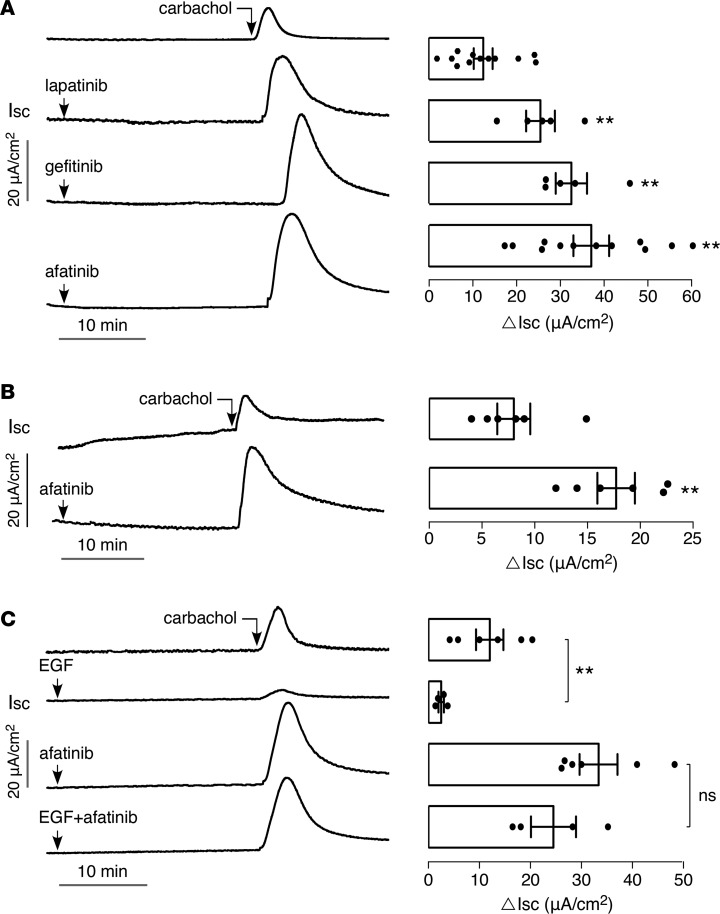
Figure 1. TKIs amplify carbachol-induced current in T84 cells.
(A) (Left) short-circuit current (Isc) in T84 cells showing responses to 40 μM lapatinib, 20 μM gefitinib, and 20 μM afatinib, added 25 minutes before 100 μM carbachol. (Right) summary of peak carbachol-induced current (ΔIsc, mean ± SEM, n = 5–12). (B) (Left) short-circuit current in mouse ileum showing responses to 20 μM afatinib added 25 minutes before 200 μM carbachol. (Right) summary of peak current (mean ± SEM, n = 6). (C) (Left) short-circuit current in T84 cells showing responses to 100 ng/ml EGF and 20 μM afatinib, alone and together, added 25 minutes before 100 μM carbachol. (Right) summary of peak current (mean ± SEM, n = 4–6). **P < 0.01, by 2-tailed t test.

