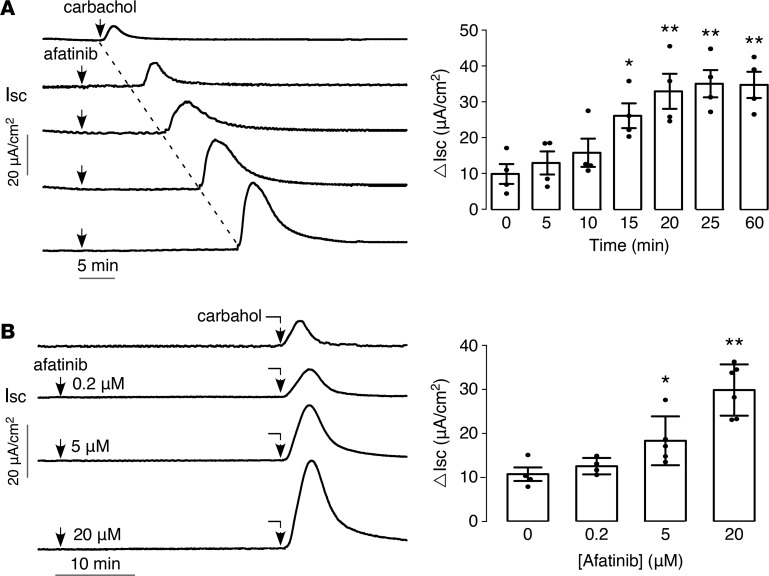
Figure 2. Time course of action and concentration dependence of afatinib’s amplification of carbachol response.
(A) (Left) time course of afatinib effect on carbachol-induced short-circuit current in T84 cells. Cells treated with 20 μM afatinib for different times before 100 μM carbachol. (Right) summary of peak carbachol-induced current (mean ± SEM, n = 4). (B) (Left) concentration dependence of afatinib effect. (Right) summary of peak current (mean ± SEM, n = 4–6). *P < 0.05, **P < 0.01, by 2-tailed t test.

