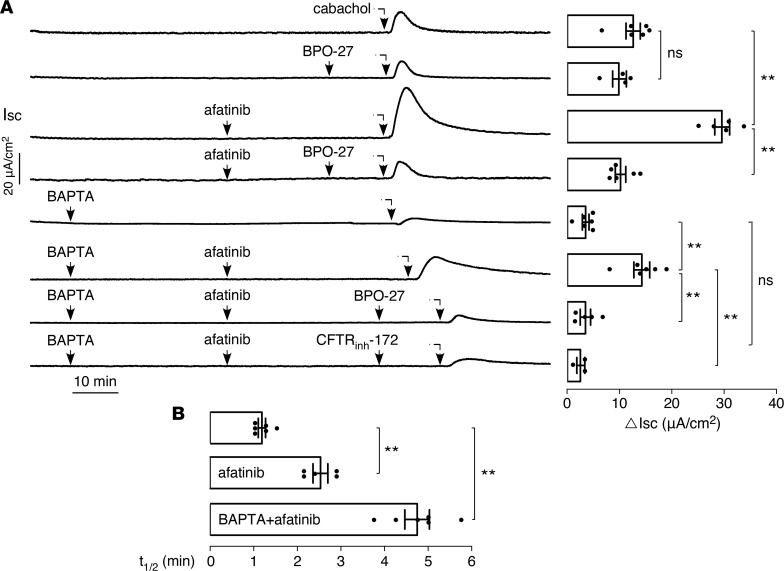
Figure 3. The afatinib-induced augmentation in carbachol current is CFTR dependent.
(A) (Left) short-circuit current in T84 cells showing effects of 20 μM afatinib, 100 μM carbachol, 10 μM BPO-27, and 10 μM CFTRinh-172, with or without 30 μM BAPTA-AM, as indicated. (Right) summary of peak carbachol-induced current (mean ± SEM, n = 3–6). (B) Half-time (t1/2) of the decreasing phase of the carbachol response curve (mean ± SEM, n = 5–6). **P < 0.01, by 2-tailed t test.

