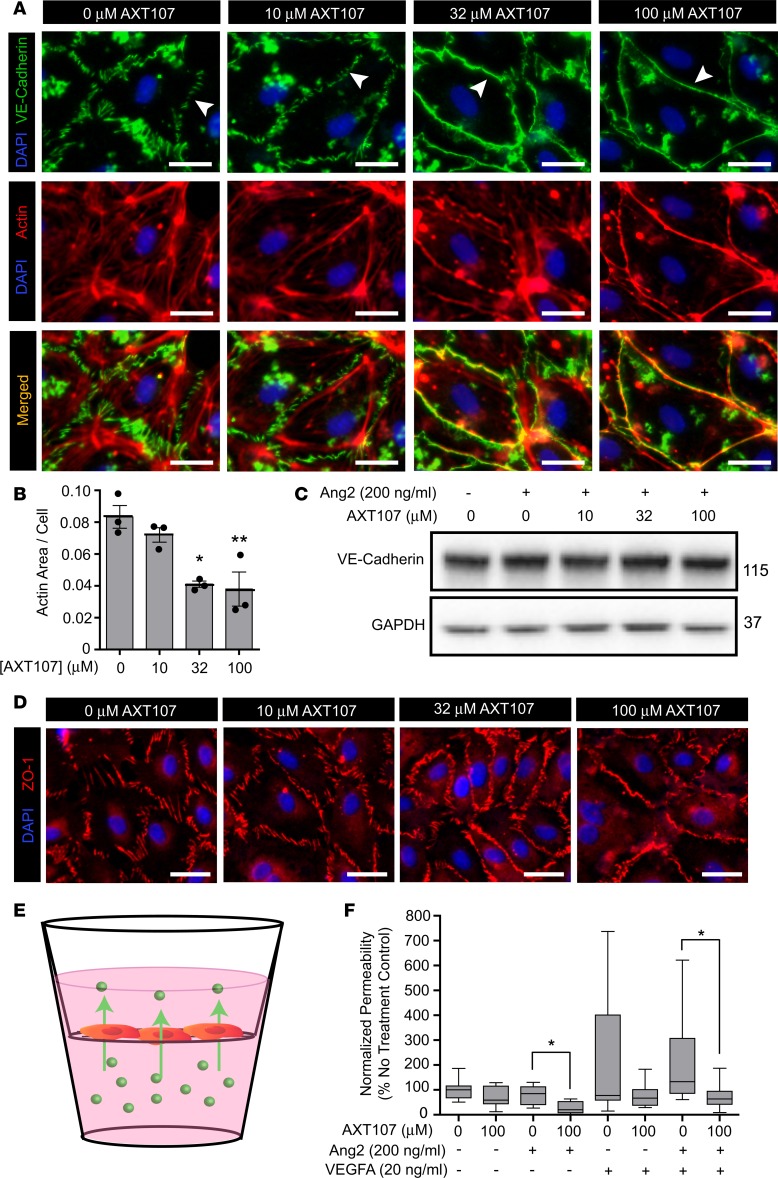
Figure 4. AXT107 treatment strengthens endothelial cell junctions.
(A) Immunofluorescence images of MEC monolayers treated with 200 ng/ml Ang2 and various concentrations of AXT107 that have been stained with DAPI (blue) and antibodies against VE-cadherin (green) and F-actin (red); merged regions are shown in yellow. Arrows indicate representative regions showing transition of VE-cadherin distribution (n = 3). Scale bars: 25 μm. (B) Average area of F-actin coverage per cell (n = 3). *P < 0.05, **P < 0.01 by 1-way ANOVA relative to Ang2-alone control. (C) Representative Western blots of VE-cadherin from MEC monolayers treated with 200 ng/ml Ang2 for 3 hours and various concentrations of AXT107. GAPDH is included as a loading control. (D) Immunofluorescence images prepared as in A and stained with DAPI (blue) and an antibody against ZO-1 (red). Scale bars: 25 μm. (E) Schematic of the transendothelial permeability assay. (F) Quantification of FITC-dextran (40 kDa) migration across MEC monolayers plated on semipermeable substrates following treatment with growth factors and AXT107 where indicated (n ≥ 7). *P < 0.05 by Student’s 2-tailed t test.

