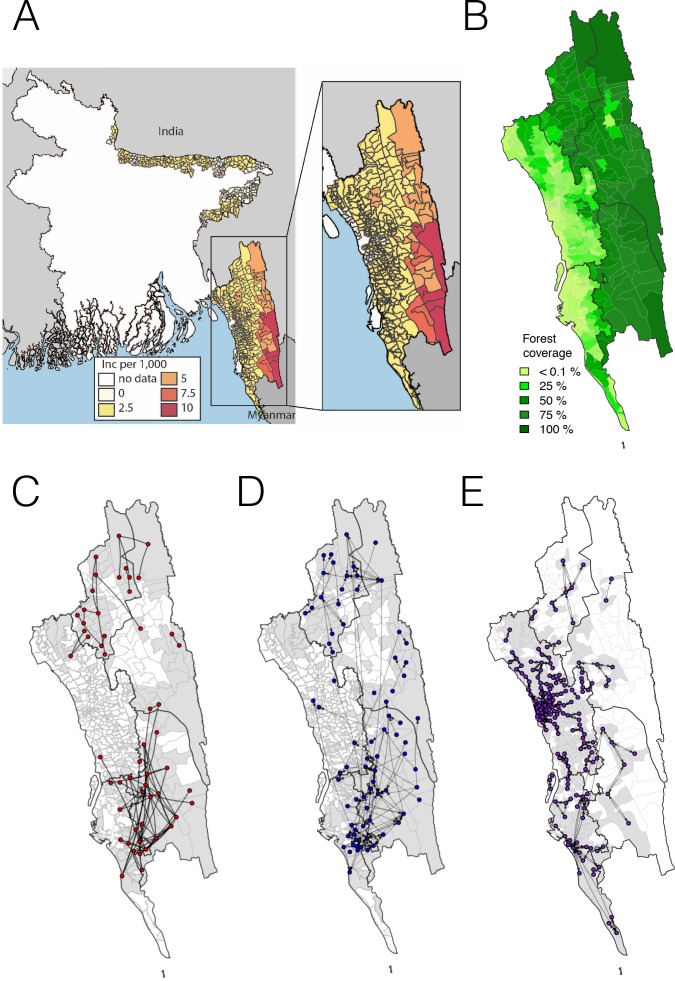
Figure 1. The incidence of malaria and spatial connectivity in the Chittagong Hill Tracts (CHT) Region.
(A) The average monthly incidence per 1000 population of P. falciparium malaria from 2015 to 2016 as reported by the NMEP. Incidence was highest in the eastern portion of the CHT (shown in relation to the country borders) and decreased westward. (B) The forest coverage (%). (C) Unions sharing at least one parasite with identical genetic barcodes. (D) Top 50% of most traveled routes reported between pairs of locations from the travel survey data. (E) Top 1% of routes traveled between pairs of locations from the mobile phone data. Unions were colored grey where data was collected on genetic (C), travel survey (D) or mobile phone data (E).


