. 2019 Apr 2;8:e43481. doi: 10.7554/eLife.43481

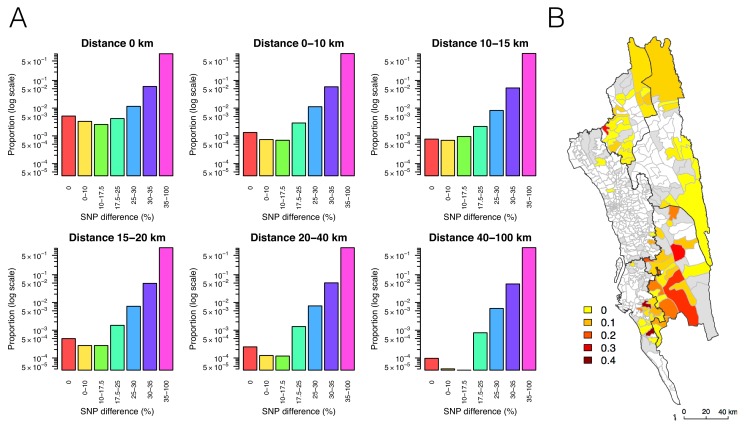
Figure 3. The relationship between genetic and geographic distance.

(A) The association between genetic data and geographic distance was only obvious for small SNP differences. Pairs of parasites sampled from unions that are geographically closer were more likely to be genetically similar. The proportion of intermediate or high SNP differences did not vary much with geographic distance. (B) The genetic mixing index for each location. Unions were colored white if they did not include genetic data and grey if they included genetic data but their genetic mixing index was not identifiable due to lack of samples that were both nearby and genetically similar. High genetic mixing index suggests high parasite flow or importation.

Figure 3.

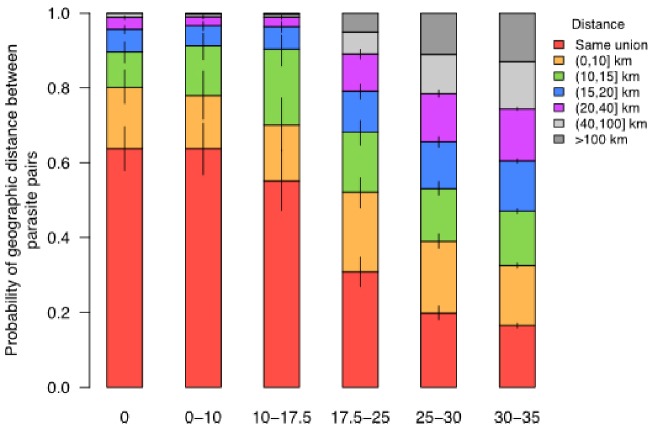
Figure 3—figure supplement 1. The probability that parasites were sampled from locations within a specified geographic distance (red – purple) given different levels of SNP differences.

Figure 3—figure supplement 1.

The probability of coming from nearby locations decreased with the SNP difference. For example, if the SNP difference is smaller than 17.5%, the probability of residing at unions that were within 20 km was higher than 0.95.
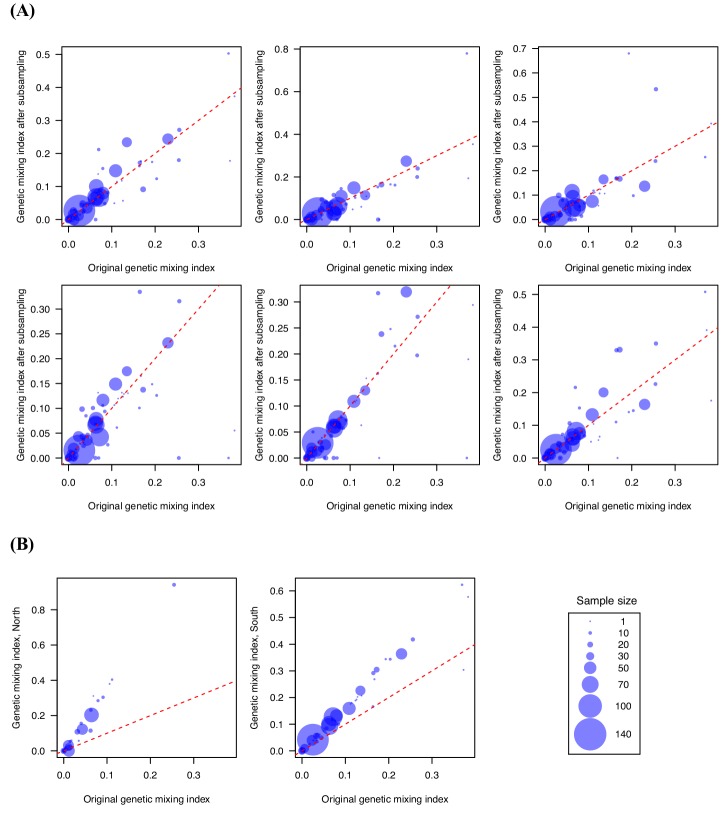
Figure 3—figure supplement 2. Genetic mixing index was robust to subsampling randomly and geographically.

Figure 3—figure supplement 2.

We performed subsampling (80%) (A) and separated the northern and southern samples (B) to test the sensitivity of genetic mixing index to sampling, and the results remained qualitatively similar. (A) shows six independent replicates of subsampling. The latitude of 22.6 was used as the cutoff for separating the northern and southern samples. These results suggest that the importation index is a robust measure.
Figure 3—figure supplement 3. Examples of genetic mixing index.
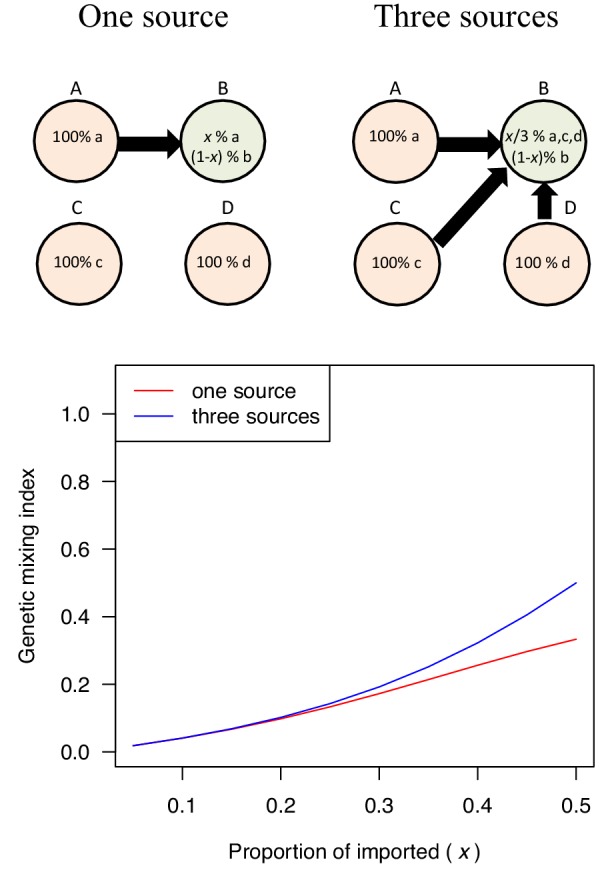
Figure 3—figure supplement 3.

We constructed simplified genetic models in order to provide intuitive interpretation for the genetic mixing index. In the simplified genetic model, we assumed that each location had its own genetic lineage (a, b, c, or d) and migration introduced genetic lineage from one location to the other (x). The model results indicate that the genetic mixing index of population B increased with the proportion of imported cases and the number of source populations.