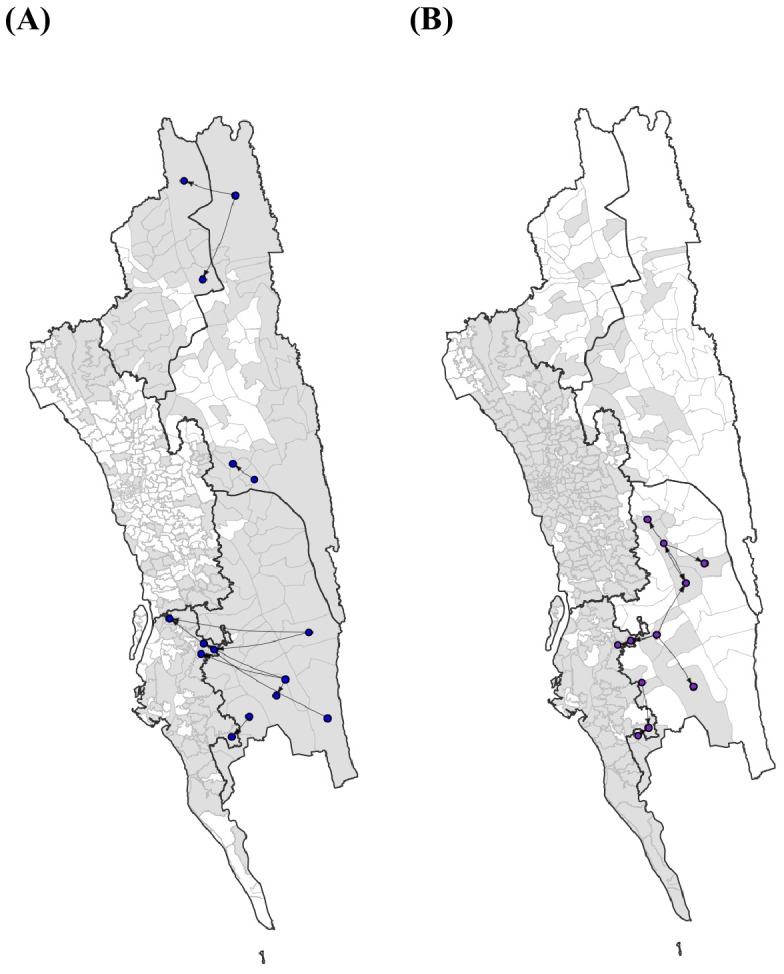
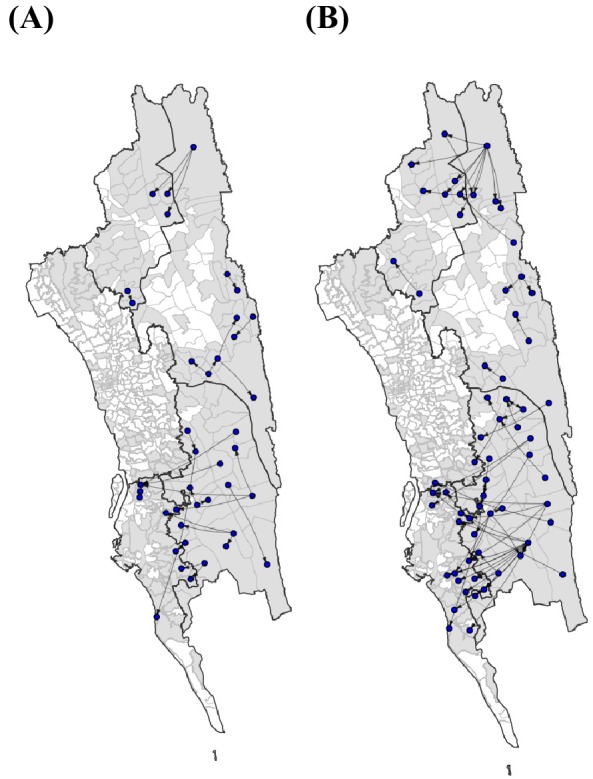
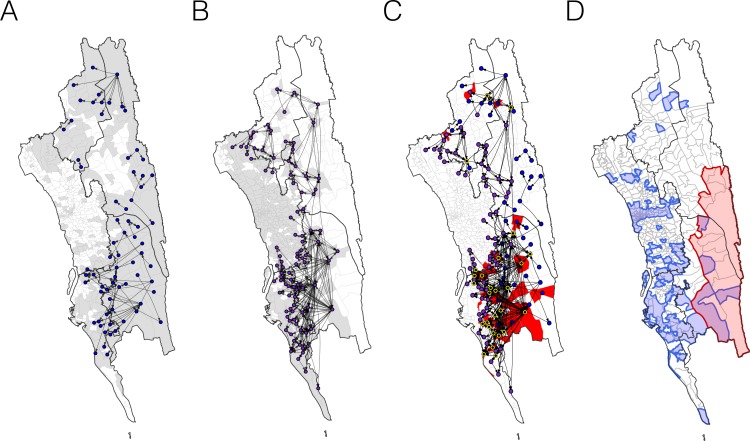
Figure 5. The estimated routes of parasite importations.
(A–B) We estimated parasite flows between unions using epidemiological models parameterized by the travel survey (A) or mobile phone data (B). The top routes of parasite flows (the top 25% for travel survey and the top 1% for mobile phone) and their origins and destinations were shown by lines and dots, respectively. Unions were colored grey if they included travel survey (A) or mobile phone data (B). The top routes of parasite flows accounted for 86.4% (travel survey) and 87.8% (mobile phone) of the total importation. (C) The combined map showing top parasite importation routes from the travel survey (nodes colored blue), mobile phone data (nodes colored purple), or both (nodes colored black with a yellow outline). Unions were shown in red if they had a high genetic mixing index. (D) An updated risk map for malaria transmission in the CHT: unions with high genetic mixing index (>0.1) or a high proportion of imported cases estimated from the epidemiological models (blue: top 25% from the travel survey, top 1% from the mobile phone data), high incidence areas (red: the average monthly incidence per 1000 population >4), and unions that have both high incidence and a high importation level (purple).
Figure 5—figure supplement 1. The top 10 routes of parasite flows.

Figure 5—figure supplement 2. The top routes of importation based on different types of travel.


