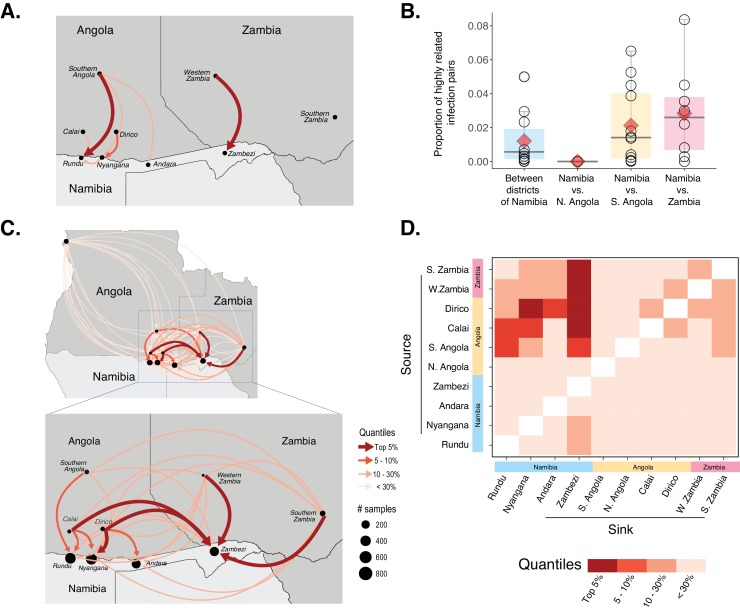
Figure 5. Cross-border connectivity estimated from genetic and travel survey data.
(A) Cross-border connectivity estimated from travel survey data. Importation was estimated from the proportion of individuals who reported travel to each destination weighted by the ratio of malaria incidence from local health system data at a destination to the residence location (see Materials and methods). The importation estimate was visualized on the map and colored by quantiles (lowest values - light pink, highest values - dark red). The arrows indicate the direction of malaria importation. Three individuals reported travel beyond the scope of the map: two individuals, from Andara and Zambezi, reported travel to northern Angola and one individual from Zambezi reported travel to Northern Province of Zambia. (B) Samples across Namibia, Angola, and Zambia were genotyped and the proportion of highly related infections are shown between health districts of Namibia and between Namibia and northern Angola, southern Angola and Zambia. The mean proportions of highly related infections are indicated by red diamonds. (C) Importation estimates and directionality of parasite flow was estimated from genetic data along with malaria incidence values in the pairs of locations indicated. Estimates of importations between locations are shown by quantiles (lowest values - light pink, highest values - dark red). The arrows indicate the direction of malaria importation. Estimates of importations were based on the proportion of highly related infections between pairs of location weighed by the ratio of malaria incidence between the two locations (See Materials and methods: Estimates of cross-border importation and connectivity). Locations in Angola are indicated for centroid location of Calai area, Dirico area and the Cuando Cubango province (i.e. southern Angola). For Namibia, centroid locations of the health districts were indicated. For Zambia, centroid locations of Western and Southern provinces are shown. Northern Angola was not strongly related to samples in the study area and corresponding cross-border region, suggesting that parasite flow between southern and northern Angola is less than that between (more geographically proximate) cross-border regions of northern Namibia and southern Angola. (D) Heat map showing sources and sinks in the Namibia-Angola-Zambia block. Within the regional block, locations within Namibia were related to locations across the border, with higher estimated parasite flow to Zambezi from these locations than to Kavango East. Interestingly, locations in Zambezi demonstrated more connectivity to Calai, Dirico, Western and Southern Zambia than locations in Kavango East.

