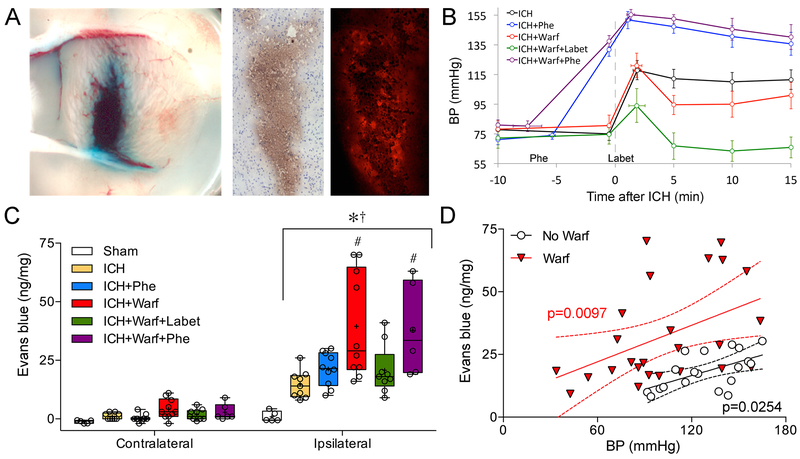
Figure 2: Secondary hemorrhage after intrastriatal blood injection.
(A) Coronal cut through the primary hematoma (15 μl) and secondary hemorrhage marked by grossly visible Evans blue around the periphery after intrastriatal blood injection (left panel), and cryosections from the same brain showing DAB staining (middle panel) and Evans blue fluorescence (right panel) (image size 920 × 1800 μm). Similar images were obtained using 70kDa FITC-dextran as a surrogate for secondary bleeding (not shown).
(B) The time course of mean arterial BP is shown at 10 minutes before blood injection (−10 min), just before Phenylephrine (Phe) administration (−5 to −8 min), at baseline immediately before blood injection (−0.5 min), peak BP after blood injection (2 to 3 min), and 5, 10 and 15 min after blood injection. Labetalol (Labet) was administered right after the completion of intrastriatal blood injection, with or without warfarin (Warf) anticoagulation. These interventions created three tiers of BP (upper tier: ICH+Phe and ICH+Warf+Phe; middle tier: ICH and ICH+Warf; lower tier: ICH+Warf+Labet). The average time of Phe administration in the relevant groups, and the time when peak BP is reached after intrastriatal blood injection in all groups are shown with their standard deviations as horizontal error bars.
(C) Hemispheric Evans blue fluorescence as a surrogate for secondary bleeding in six experimental groups (p<0.0001 ipsilateral vs. contralateral hemisphere and among treatments; two-way ANOVA for repeated measures followed by Newman-Keuls multiple comparisons test; *p<0.05 vs. contralateral; †p<0.05 vs. ipsilateral sham; #p<0.05 vs. ipsilateral ICH, ICH+Phe and ICH+Warf+Labet.
(D) Secondary hemorrhage was directly correlated with BP in both non-anticoagulated (circles) and anticoagulated (triangles) cohorts, shown and analyzed separately along with p values, best fit and 95% confidence intervals (linear regression). The slopes of two fits did not significantly differ (p=0.7169).

