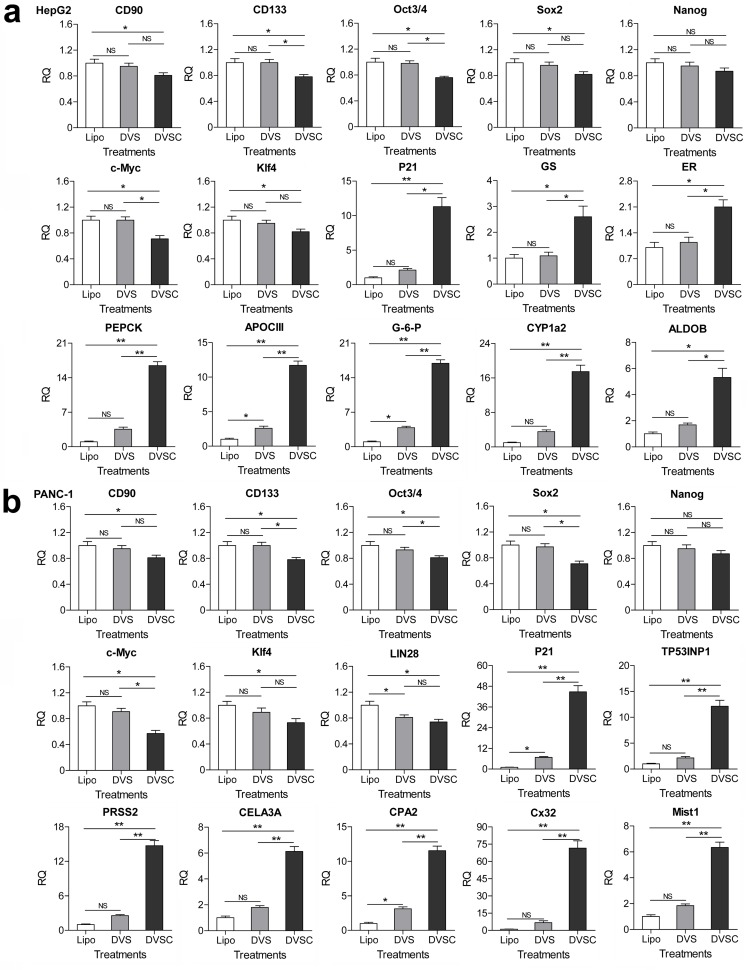
Figure 4. Changes of gene expression in the HNF4α-activated HepG2 cells and E47-activated PANC-1 cells.
(a and b) Changes of gene expression in the HNF4α-activated HepG2 cells (a) and E47-activated PANC-1 cells (b). The gene transcription was detected by qPCR and the expression level is shown as the relative RNA expression fold to house-keeping gene GAPDH. Data are shown as mean ± SD, n = 3. The statistical difference was analyzed by Student’s t test. *, p<0.05; **, p<0.01; NS, no significant statistical difference. Transfection: Lipo, lipofectin; DVS, dCas9-VP64/sgRNA; DVSC, dCas9-VP64/csgRNA2-sCMV.

