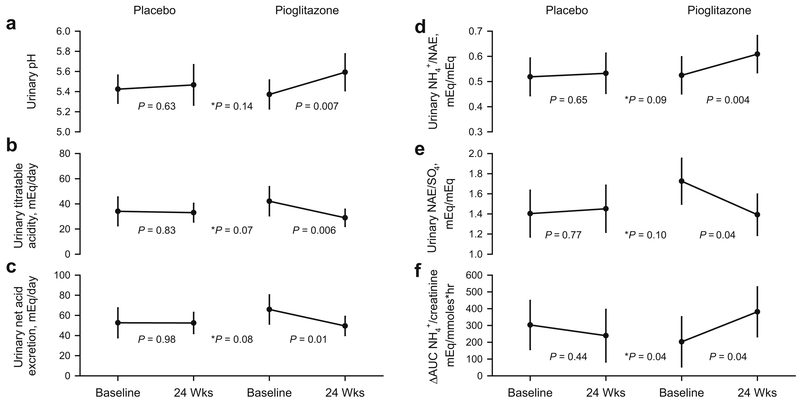
Figure 3. Acid-base profile.
Data shown as Least Square Means ± 95% confidence intervals. P values indicate difference between Baseline and 24 Weeks, * indicates the treatment and visit interaction P value for comparison between placebo and pioglitazone. Figure 3A-3E refer to 24hr urine studies. Figure 3F refers to acute response to an NH4Cl load.

