
Figure 4.
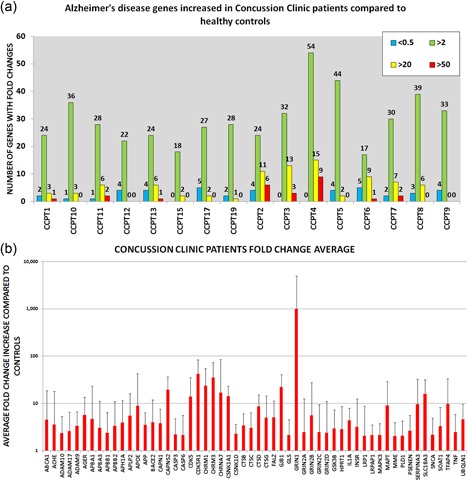
Gene expression information of concussion clinic patients. (a) Number of genes upregulated and downregulated. Upregulated genes are shown in three tiers: fold increase 50‐fold higher than controls in red, 20‐fold higher in yellow, and a fold change of two in green. Downregulated gene expression <0.5 shown in blue. (b) All the genes that had a two‐fold increase in expression or higher. Error bars represent standard deviation [Color figure can be viewed at wileyonlinelibrary.com]