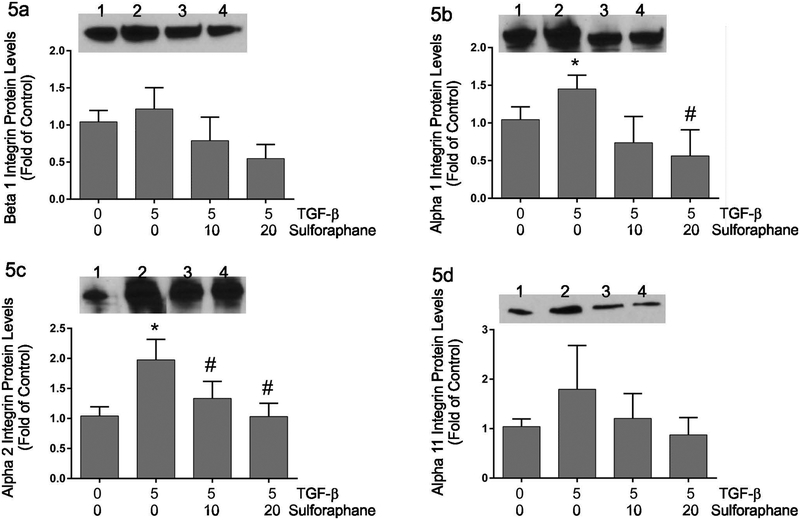
Figure 5.
These graphically illustrate immunoblot data for β1 (Figure 5a), α1 (Figure 5b), α2 (Figure 5c) or α11 (Figure 5d) integrin. Image analysis data for each integrin were normalized to data from the same blots probed for glyceraldehyde phosphate dehydrogenase and are presented as fold of untreated controls. The insets show representative immunoblots with each integrin antiserum. Lanes on the insets are: 1) untreated controls, 2) treatment with TGF-β1 alone, 3) treatment with TGF-β1 and 10 μM sulforaphane and 4) treatment with TGF-β1 and 20 μM sulforaphane. Statistical significance (p < 0.05) was determined relative to untreated controls (*) or TGF-β1 treatment alone (#). n = 5 independent experiments.

