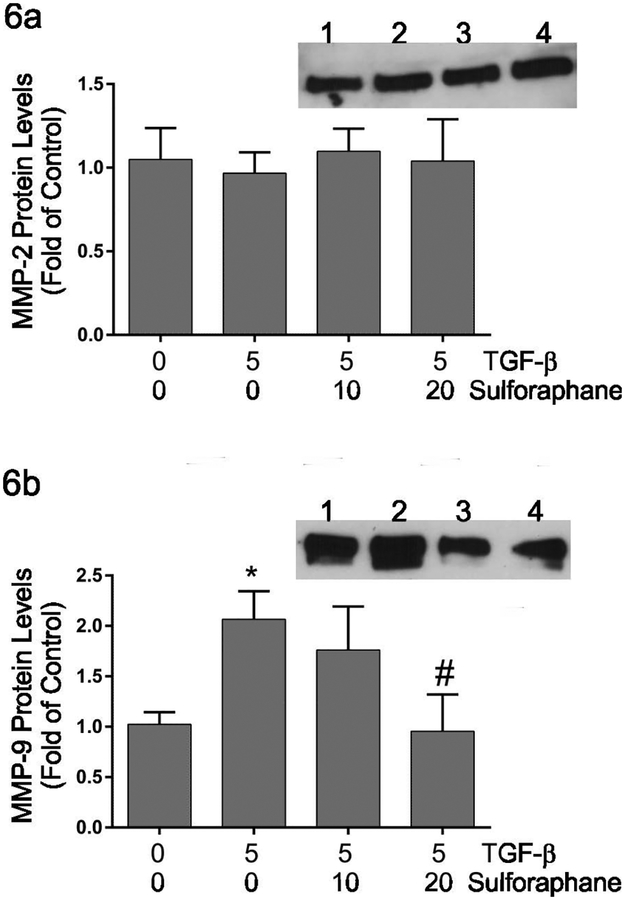
Figure 6.
This graphically shows relative levels of MMP2 (Figure 6a) or MMP9 (Figure 6b) protein in conditioned medium following treatment of cardiac fibroblasts with TGF-β1 and/or sulforaphane. The insets demonstrate representative immunoblot images with the respective primary antisera. Lanes on the insets are: 1) untreated controls, 2) treatment with TGF-β1 alone, 3) treatment with TGF-β1 and 10 μM sulforaphane and 4) treatment with TGF-β1 and 20 μM sulforaphane. Statistical significance (p < 0.05) was determined relative to untreated controls (*) or TGF-β1 treatment alone (#). Data are presented as the levels of the respective MMP in treated fibroblasts relative to untreated controls. n = 5 independent experiments.

