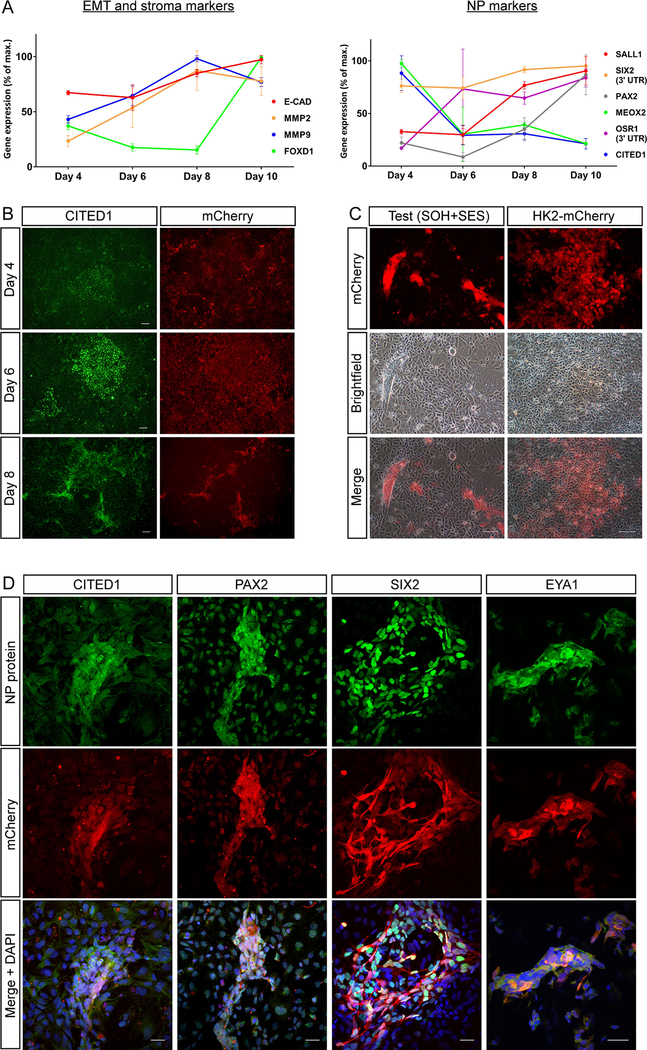
Figure 2: HK2 cells show evidence of reprogramming in vitro when transfected with the reprogramming transposons, pT-SOH and pT-SES.
(A) Quantitative RT-PCR (qRT-PCR) time course analysis of EMT, stoma and NP genes in HK2 cells undergoing reprogramming for 4, 6, 8 and 10 days. Normalised gene expression at each time point is presented as a percentage of the maximum expression observed across the experiment duration. Error bars represent ± SD of the mean. (B) CITED1 immunofluorescence time course analysis of HK2 cells from (A), depicting CITED1 and mCherry expression at days 4, 6 and 8 of reprogramming. Scale bars represent 500 μm. (C) Brightfield and fluorescence images of test (transfected with reprogramming transposons) and control (expressing mCherry only) HK2 cells after 8 days of reprogramming. Scale bars represent 500 μm. (D) Immunofluorescence of NP proteins in reprogramming transposon-transfected cells following 8 days of reprogramming. Scale bars represent 30 μm.

