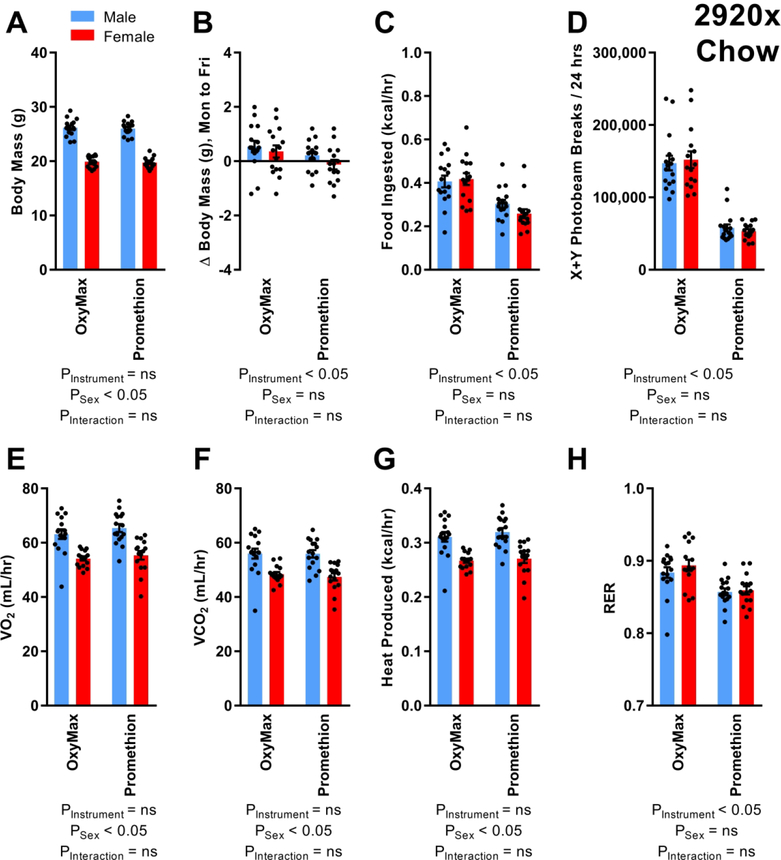
Figure 2. C57BL/6J mice fed 2920x chow, at 10–11 weeks of age.
(A) Body masses of mice entering OxyMax and Promethion systems. (B) Change in body mass over four 24-hour cycles. (C) Food ingested, corrected for digestible calories per gram. (D) Photoelectric beam breaks in X+Y planes. (E) Rate of O2 consumption. (F) Rate of CO2 production. (G) Heat production as estimated using the Weir equation. (H) Respiratory exchange ratio. For all endpoints, n=16 males and 15 females. Comparisons performed by two-way repeated-measures ANOVA. Summary data are presented as mean ± SEM.

