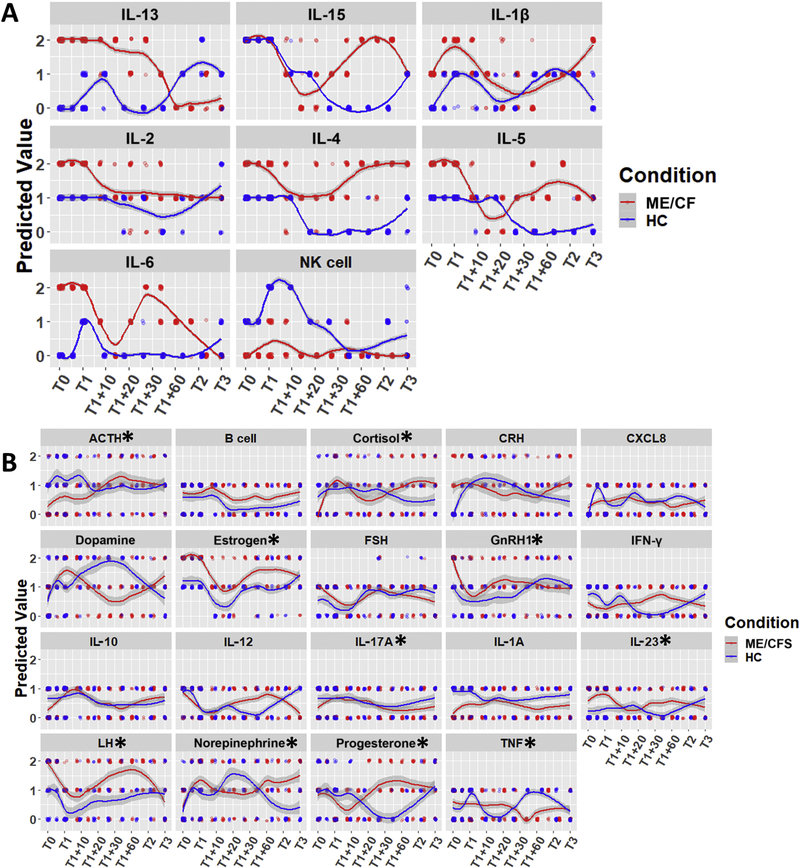
Figure 2.
Predicted trajectories for all network entities across 26 top-performing solutions; subjects underwent maximum stress at T1. A) Predicted trajectories for measured and constrained immune entities showing adherence to data. B) Putative trajectories for unconstrained entities. Lines depict LOESS curves with 95% confidence intervals (points are jittered to show relative frequency; * indicates p<0.05 for both ME/CFS condition and its interaction with time, BH-corrected ANOVA).

