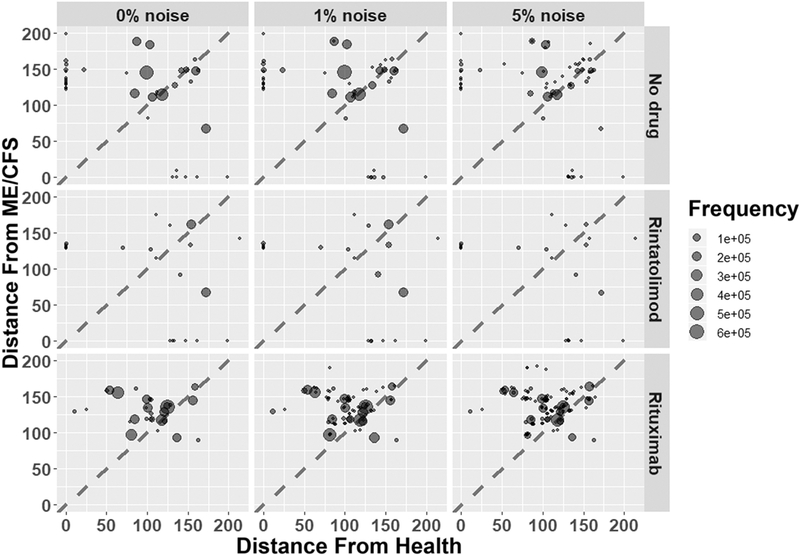
Figure 4.
Results of simulated drug treatments. Each attractor is represented by a point, sized according to the number of simulations reaching it. Axes represent the Euclidean distance of each attractor from the Health and ME/CFS states multiplied by the betweenness centrality of each entity. Points above the diagonal are more similar to Health than to ME/CFS (less pathological); points below the diagonal are more similar to ME/CFS than to Health (more pathological).

