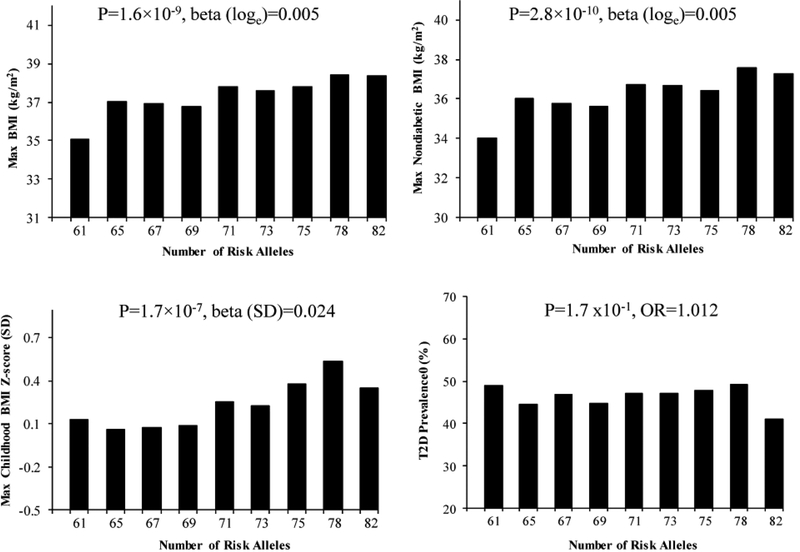
Figure 1.
The aggregate effect of 82 lead SNPs on maximum BMI in adulthood (n=3491, age ≥15), maximum BMI recorded at a non-diabetic exam (n=2862, age ≥15), maximum BMI z-score in childhood (n=1958, age 5–15) and T2D (n=3747) in full-heritage Pima Indians. The GRS was created by summing the number of the risk alleles of all 82 SNPs with a mAF ≥ 0.01 with equal weight for each locus. The p values were adjusted for age, sex, birth year and the first five genetic principal components. Individuals were divided into 9 categories based on the GRS: ≤63, >63- ≤66, >66- ≤68, >68- ≤70, >70- ≤72, >72- ≤74, >74- ≤76, >76- ≤79, >79 risk alleles. In the figure, the value on the x-axis reflects the mean GRS for individuals within each category.

