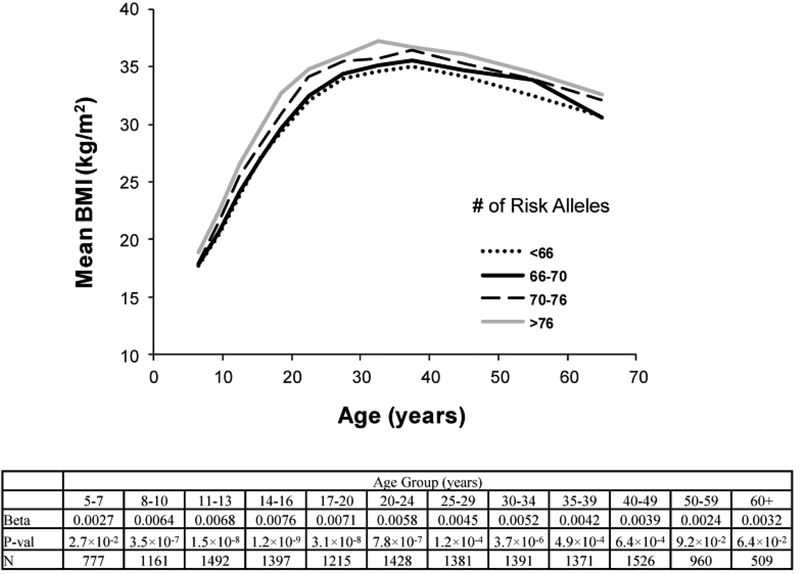
Figure 2.
The aggregate effect of 82 lead SNPs on BMI at various ages in Pima Indians. For the life-time assessment of BMI with the genetic risk score within discrete age groups which cross childhood and adulthood, the logarithm of BMI was uniformly analyzed in all age groups to avoid discontinuity of units across childhood and adulthood. Within each discrete group, the analyses are adjusted for age, sex, birth year and the first five genetic principal components. The beta coefficient [loge(BMI) per unit GRS], p value and number of subject for each age group were listed.

