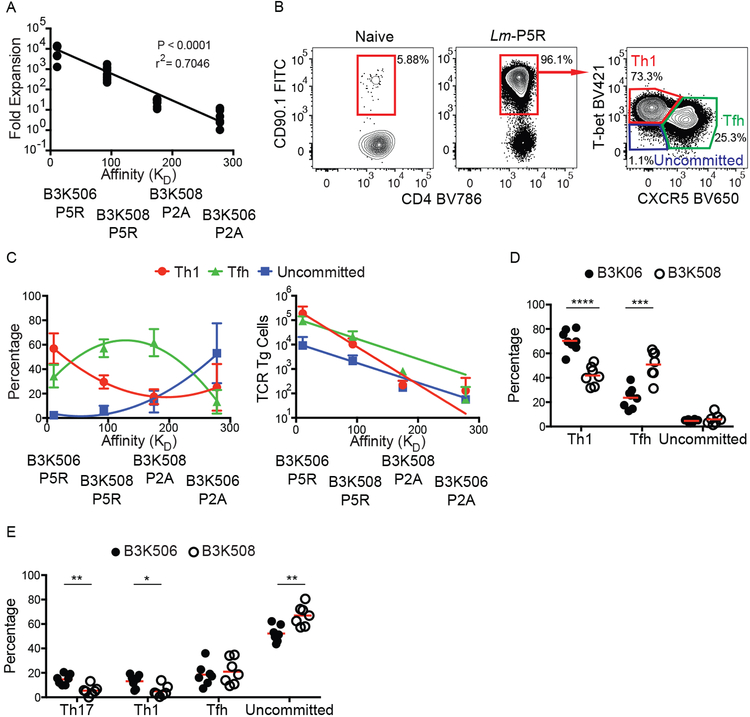
Figure 1. TCR affinity differences between B3K506 and B3K508 cells influence T cell expansion and bias T cell differentiation.
(A) Fold expansion of B3K506 or B3K508 cells seven d after Lm-P5R (n=7) or Lm-P2A (B3K506 n=7, B3K508 n=8) infection plotted in relation to the affinity of the relevant TCR-p:MHCII interaction. (B) Representative flow cytometric identification of TCR Tg cells (red gates in the left and middle panels) in naive or Lm-P5R infected mice. Th1 (T-bet+), Tfh (CXCR5+), or uncommitted (T-bet− CXCR5−) cells were identified in the right panel in the red, green and purple gates, respectively. (C) Differentiation (Th1 in red, Tfh in green, and uncommitted in blue) of B3K506 or B3K508 cells seven d after Lm-P5R (n=7) or Lm-P2A (B3K506 n=7, B3K508 n=8) infection plotted in relation to the affinity of the relevant TCR-p:MHCII interaction. (D) Frequency of Th1, Tfh, or uncommitted cells among B3K506 (filled circle, n=8) or B3K508 (empty circle, n=7) effector cell populations seven d after infection with influenza PR8-P5R. (E) Frequency of Th17, Th1, Tfh, or uncommitted cells among B3K506 (filled circle, n=7) or B3K508 (empty circle, n=7) cells seven d after intranasal infection with Lm-P5R. The bars in D and E represent the mean. Pooled data from two or three independent experiments are shown. Spleens were analyzed for the depicted experiments. Multiple t tests were used to determine significance for D and E. A linear regression was used to calculate significance for A and a nonlinear fit was used to calculate the r2. * = p < 0.05, ** = p < 0.01, *** = p < 0.001, **** = p < 0.0001.

