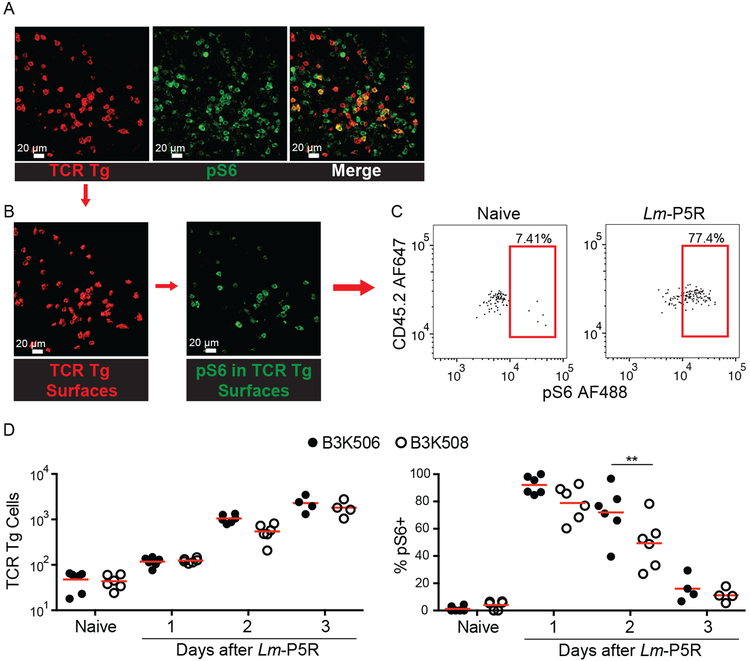
Figure 3. Histo-cytometry analysis of the effect of TCR affinity on T cell activation.
(A) Representative images of TCR Tg cells identified with CD45.2 (red) and pS6 (green) in a spleen one d post-Lm-P5R infection. (B) Digital surfaces of the cells were created and analyzed with histo-cytometry. (C) TCR Tg cell expression of pS6 was then quantified in Flowjo. (D) Histo-cyotmetric quantification of B3K506 (filled circle) and B3K508 (empty circle) cell numbers and their pS6 expression in naïve mice and mice during the initial three d following Lm-P5R infection (naïve, d 1, d 2 n=6; d 3 n=4). The bars in B represent the mean. Scale bar, 20 μm. Pooled data from three independent experiments are shown. Spleens were analyzed for the depicted experiments. One-way ANOVA was used to determine significance for D. ** = p < 0.01.

