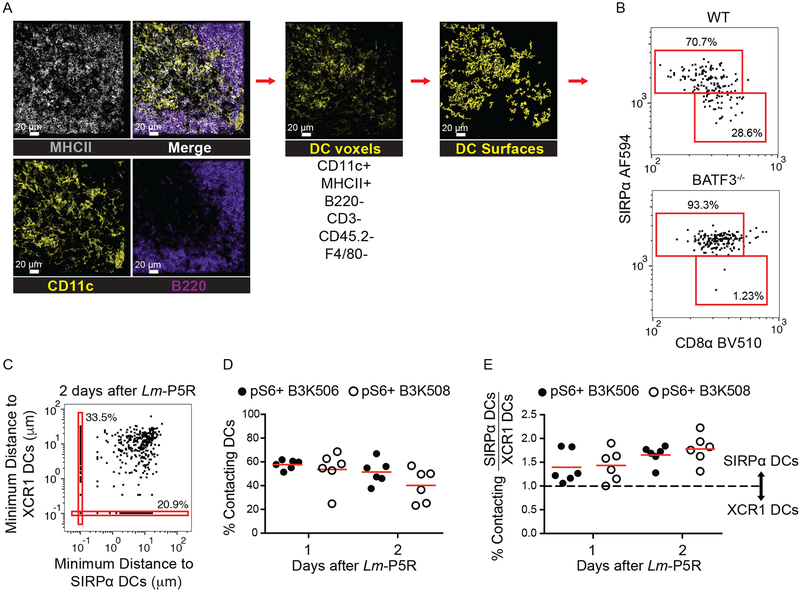
Figure 4. Histo-cytometry analysis of DCs and T cell-DC interactions.
(A) Representative images of MHCII (grey), CD11c (yellow), and B220 (purple) staining from a spleen one d post-Lm-P5R infection. Histo-cytometry was used to generate surfaces for DCs (CD11c+ MHCII+ B220− CD3− CD45.2− F4/80−). XCR1+ or SIRP⍺+ surfaces were identified among the DC surfaces based on the indicated gates. (B) Histo-cytometry identification of XCR1+ and SIRP⍺+ DCs in WT and Batf3−/− mice infected with Lm-P5R for one d. (C) Representative histo-cytometry analysis displaying the percentage of pS6+ TCR Tg cells interacting with XCR1+ or SIRP⍺+ DCs in mice infected with Lm-P5R for one or two d. Interactions are defined as TCR Tg cells that are within 0 μm of either DC subset with 10−1 μm added to each cell for logarithmic visualization. (D) Histo-cytometry-identified interactions between pS6+ B3K506 (filled circle, n=6) or B3K508 (empty circle, n=6) T cells with XCR1+ or SIRP⍺+ DCs in mice infected with Lm-P5R for one or two d. (E) Ratio of T cell interactions with SIRP⍺+ DC to XCR1+ DC interactions by pS6+ B3K506 (filled circle, n=6) or B3K508 (empty circle, n=6) T cells. The bars in D and E represent means. Scale bar, 20 μm. Pooled data from three independent experiments are shown. Spleen was analyzed for the depicted experiments. One-way ANOVA was used to determine significance for D and E. No significant differences were detected.

