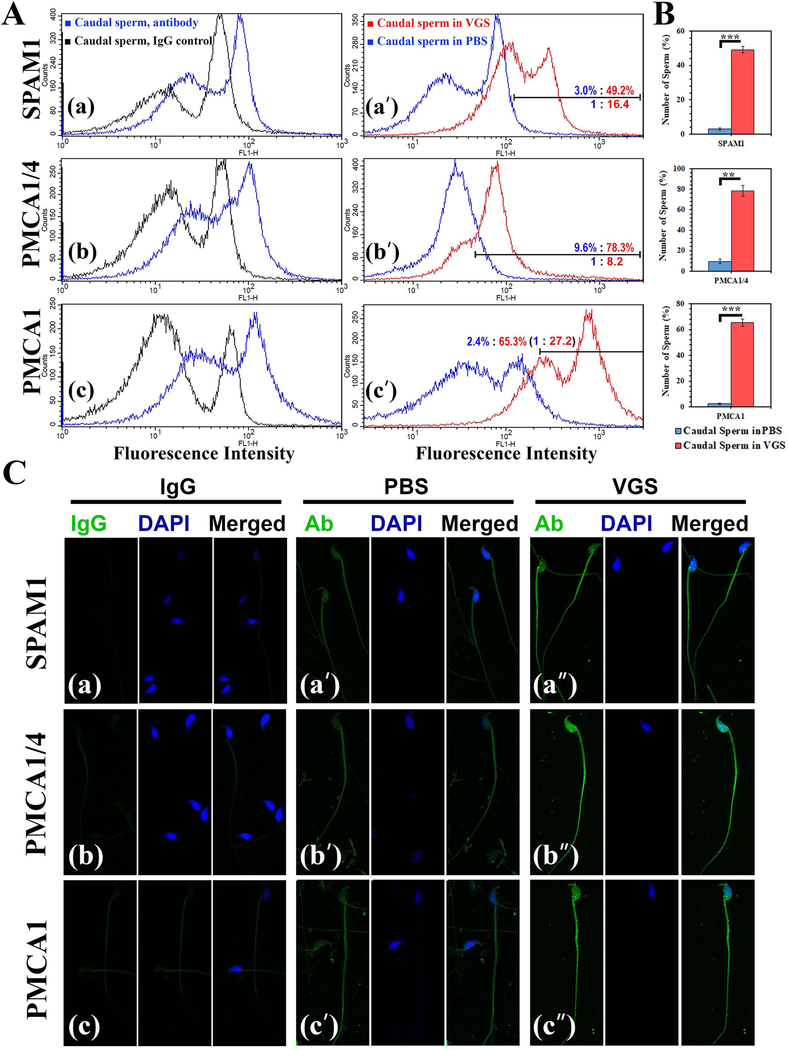
FIGURE 3:
VGS are capable of delivering PMCAs and SPAM1 to caudal sperm following co-incubation. A) Flow cytometry reveals the specificity of the antibodies: a) anti-SPAM1, b) anti-PMCA1/4, and c) anti-PMCA1 show sperm with a right peak shift of fluorescence intensity, compared to the control treated with the IgG (rabbit, PMCA1 and SPAM1; mouse; PMCA1/4). Sperm aliquots in PBS or VGS re-constituted in PBS were incubated for 30 min, and subsequently washed and processed for immunofluorescence. A-aʹ, bʹ, cʹ) Fluorescence was quantified in 50,000 cells for each sample, and the region with the highest intensity marked. The % of cells in this region reveals increases in frequencies with 16.4-fold, 8.2-fold, and 27.2-fold for SPAM1, PMCA1/4, and PMCA1 for sperm in VGS, compared to those in PBS. B) When the means of the % of PBS- and VGS-co-incubated cells in the marked region were analyzed by a t-test, the differences were significant (P<0.01) for each of the proteins (n=3). C) Confocal images of sperm immunolabeled for SPAM1, PMCA1/4, and PMCA1 are seen following co-incubation in PBS (aʹ, bʹ, cʹ) and VGS (aʹʹ, bʹʹ, cʹʹ). IgG control of each antibody is seen in (a, b, c). The signals (green) are most intense in aʹʹ, bʹʹ, and cʹʹ (sperm in VGS). The sperm heads are stained blue with DAPI in the middle panel followed by the merged image (Original magnification=×630).

