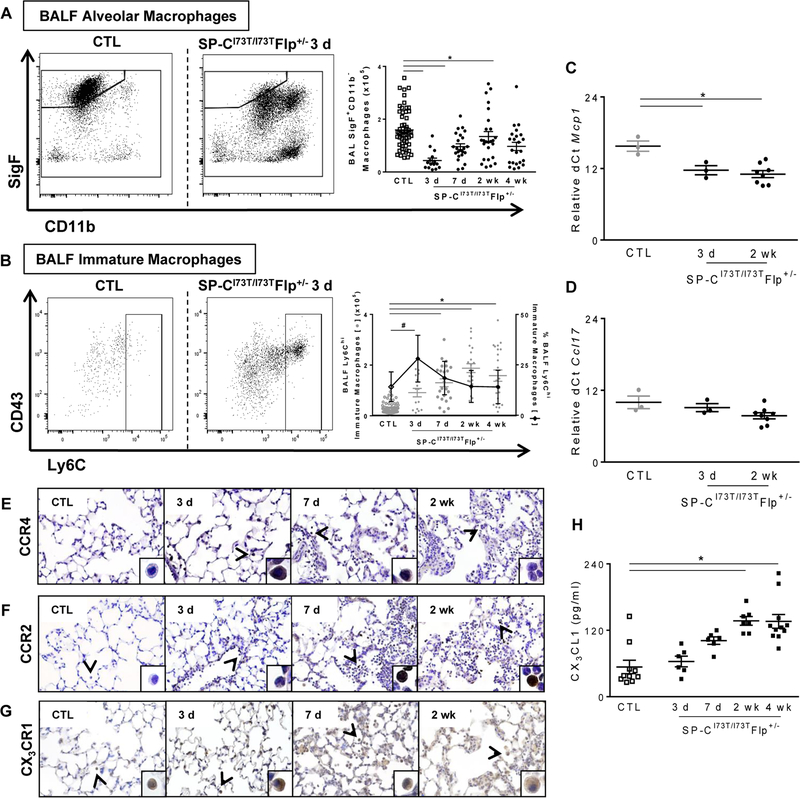
Figure. 3. Characterization of lung macrophage and peripheral monocyte dynamics in SP-CI73T mutant mice.
(A–B) Flow cytometric analysis and quantification of BALF for (A) absolute numbers of SigF+CD11c+CD11b− macrophages and (B) Ly6C+ immature macrophages (absolute numbers left y-axis and relative percentage right y-axis) collected from control (tamoxifen treated SP-CWT/WTFlp+/+ or oil treated SP-CI73T/I73TFlp+/− mice) and SP-CI73T/I73TFlp+/− mice 3 d, 7 d, 2 wk and 4 wk following intraperitoneal tamoxifen administration (250 mg/kg). (C-D) qPCR analysis of BALF cells collected from control (tamoxifen treated SP-CWT/WTFlp+/+ or oil treated SP-CI73T/I73TFlp+/− mice) and SP-CI73T/I73TFlp+/− mice 3 d, and 2 weeks following intraperitoneal tamoxifen administration (250 mg/kg) for markers associated with recruitment of (C) monocytes (Mcp1) and (D) monocyte/macrophages (Ccl17). Data are represented as mean ± SEM (N=3–8). * p < 0.05 compared to control SP-CWT/WTFlp+/+ or oil treated SP-CI73T/I73TFlp+/− mice SP-CI73T/I73TER−/− by One-Way ANOVA, using Tukey post-hoc test. (E-G) Immunohistochemical staining of lungs stained for (E) CCR4, (F) CCR2 and (G) CX3CR1 at the indicated time points showing prominent monocyte/macrophage staining (arrowheads). Note peak expression for CCR4 3 d post mutant induction, and time dependent increases in numbers of CCR2+ and CX3CR1+ macrophages. Magnification: 200x; inset magnification: 600x. Representative images are shown (N=4). (H) CX3CL1 ELISA of BALF from control (tamoxifen treated SP-CWT/WTFlp+/+ or oil treated SP-CI73T/I73TFlp+/− mice) and SP-CI73T/I73TFlp+/− mice 3 d, and 2 weeks following intraperitoneal tamoxifen administration (250 mg/kg). Data are represented as mean ± SEM (N=6–11). Controls were pooled from controls at all 3 time points. *p< 0.05 versus control group using 1-way ANOVA followed by Tukey’s post hoc test.

