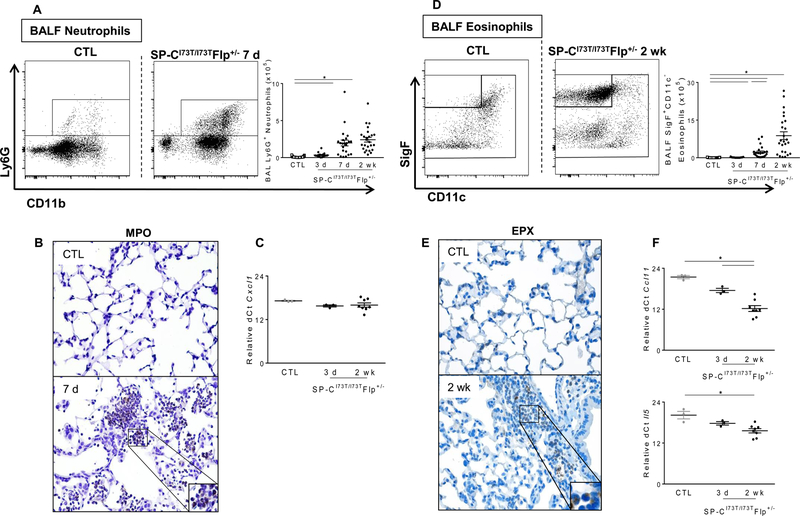
Figure 5. Characterization of BALF neutrophil and eosinophil recruitment in SP-CI73T mutant mice.
Flow cytometric analysis and quantification of BALF (A) Ly6G+ neutrophil and (D) SigF+CD11c− eosinophil subsets collected from BALF in control (tamoxifen treated SP-CWT/WTFlp+/+ or oil treated SP-CI73T/I73TFlp+/− mice) and SP-CI73T/I73TFlp+/− mice 3 d, 7 d, 2 wk and 4 wk following intraperitoneal tamoxifen administration (250 mg/kg). Absolute quantitation was performed by multiplying the relative abundance of each myeloid subset by the BALF cell counts. Data are represented as mean ± SEM (N=25–51). Immunohistochemical staining of lungs stained for (B) myeloperoxidase and (E) eosinophil peroxidase (EPX). Magnification: 200x; inset magnification 600x. Representative images are shown (N=3–5). qPCR analysis of BALF cells collected from control (tamoxifen treated SP-CWT/WTFlp+/+ or oil treated SP-CI73T/I73TFlp+/− mice) and SP-CI73T/I73TFlp+/− mice 3 d, and 2 weeks following intraperitoneal tamoxifen administration (250 mg/kg) for markers associated with (C) neutrophil (Cxcl1) and (F) eosinophil (Eotaxin/Ccl11 and Il5) recruitment. *p<0.05 compared to control SP-CWT/WTFlp+/+ or oil treated SP-CI73T/I73TFlp+/− mice SP-CI73T/I73TFlp−/− by One-Way ANOVA, followed by Tukey post-hoc test.

