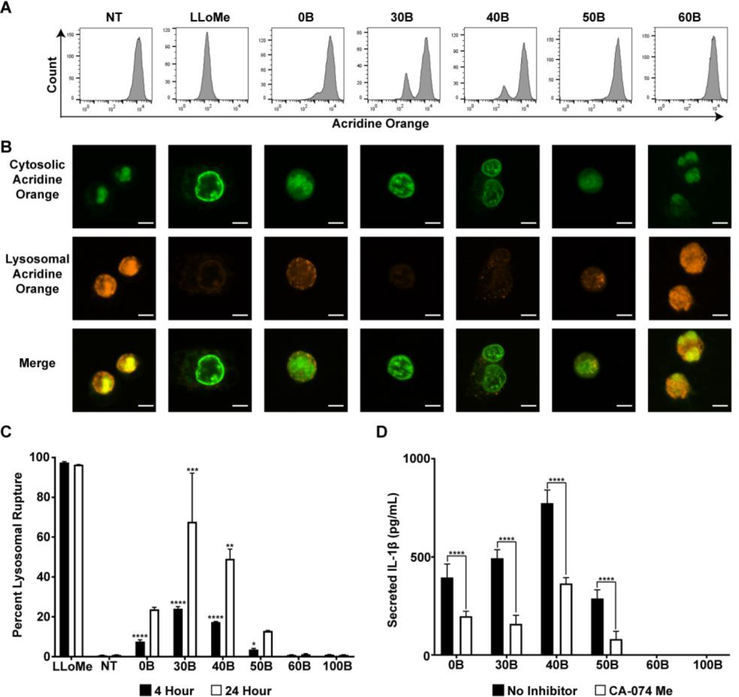
Figure 3. Evaluation of lysosomal rupture in response to PEG-b-(DMAEMA-co-BMA) polymers.
(A) Representative flow cytometry histograms of THP-1 cells stained with acridine orange (lysosome accumulating dye). THP-1 cells were not treated (NT), incubated with LLoMe (positive control), or treated with indicated polymer solution for 4 hours. (B) Representative fluorescent microscopy images of acridine orange stained THP-1 cells are shown where loss of staining indicates lysosomal rupture. THP-1 cells were not treated (NT), treated with LLoMe (positive control), or treated with polymer solutions for 4 hours and stained with acridine orange for 20 minutes before imaging. Scale bars represent 5 μm. (C) Quantification of lysosomal rupture as measured by flow cytometry in THP-1 cells that were either not treated (NT), treated with LLoMe (positive control), or treated with polymer solutions for 4 or 24 hours and stained with acridine orange for 3 hours. Amount of acridine orange in cells measured using flow cytometry (n=2; one-way analysis of variance (ANOVA); p-value corresponds to percent rupture of each polymer compared to percent rupture of NT, for each time point independently). (D) IL-1β secretion from THP-1 cells treated with LPS (100 ng/mL) for 3 hours and then polymer solutions (10–40 μg/mL) for 4 hours with or without pre-treatment with CA-074 Me (cathepsin inhibitor), measured with ELISA (n=6; two-way analysis of variance (ANOVA); p-value corresponds to CA-074 Me compared to no inhibitor for each polymer). *p<0.05, **p<0.01, ***p<0.005 ****p<0.001.

