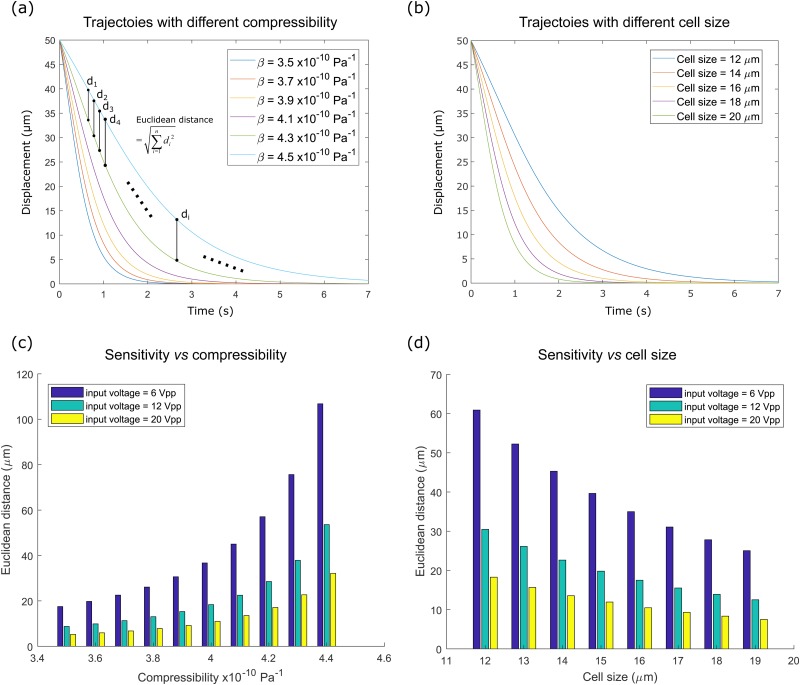
FIG. 6.
(a) A group of simulated trajectories of different compressibilities ranging from 3.5 × 10⁻¹⁰ Pa−1 to 4.5 × 10⁻¹⁰ Pa−1. di denotes the distance of the ith points of the two trajectories. Euclidean distance of trajectories is defined as the root-sum-square distance of every corresponding point from the two trajectories. (b) A group of simulated trajectories of different cell sizes ranging from 12 μm to 20 μm. (c) Sensitivity test vs compressibility under different voltages. Sensitivity was represented as the Euclidean distance between two trajectories with an increment of compressibility Δβ, i.e., Eu(R(β), R(β + Δβ)). The increment of compressibility Δβ was set as 0.1 × 10⁻¹⁰ Pa−1. (d) Sensitivity test vs cell size under different voltages. Sensitivity was represented as the Euclidean distance between two trajectories with an increment of cell size Δd, i.e., Eu(R(d), R(d + Δd)). The increment of compressibility Δd was set as 1 μm.

