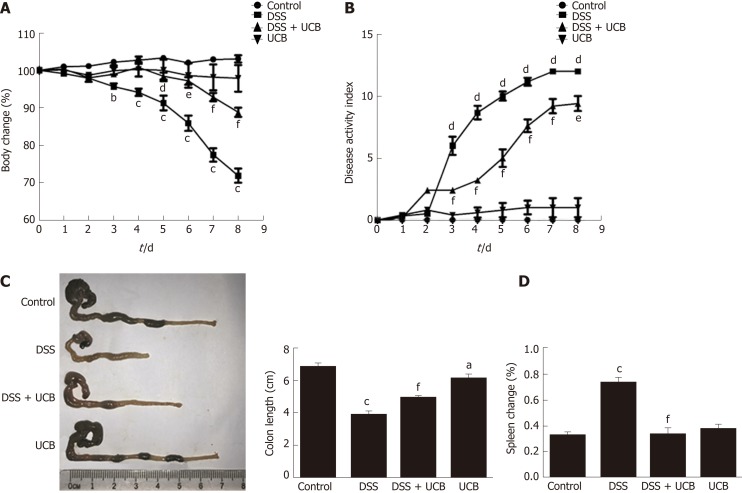
Figure 1.
UCB significantly relieved severity of dextran sulfate sodium induced colitis. A: Body weight changes, data plotted as percentage of basal body weight; B: Disease activity index; C: Changes in colon length; D: Relative spleen weight. Data are expressed as means ± SEM (n = 5). aP < 0.05, bP < 0.01, and cP < 0.001 vs control group, dP < 0.05, eP < 0.01, and fP < 0.001 vs dextran sodium sulfate group. UCB: Unconjugated bilirubin; DSS: Dextran sodium sulfate; SEM: Standard error of the mean.

