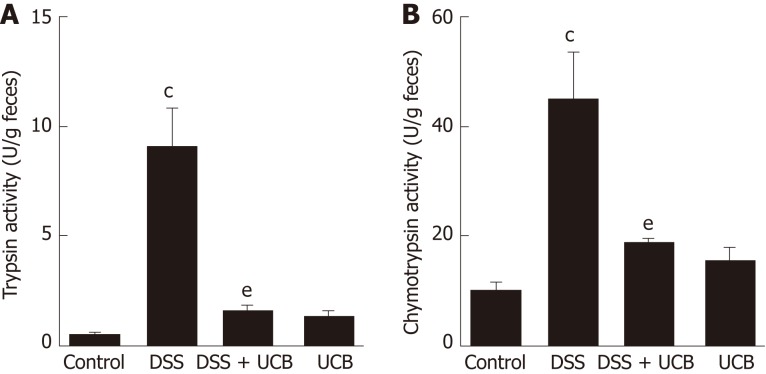
Figure 2.
UCB inactivated digestive protease activity in DSS treated mice. A: Trypsin activity in feces; B: Chymotrypsin activity in feces. Data are expressed as means ± SEM (n = 5). cP < 0.001 vs control group and eP < 0.01 vs dextran sodium sulfate group. UCB: Unconjugated bilirubin; DSS: Dextran sodium sulfate; SEM: Standard error of the mean.

