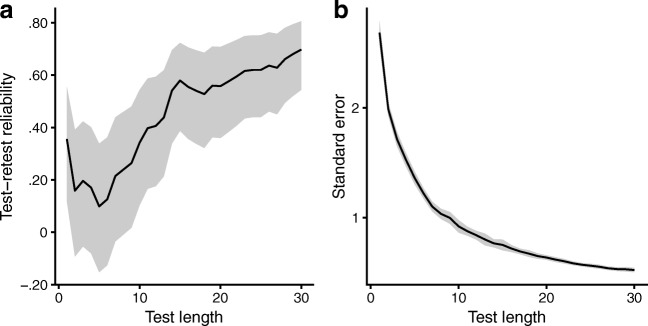
Fig. 2.
Reliability as a function of test length. (A) Evolution of test–retest reliability (Pearson correlation) as a function of test length (n = 30 items). (B) Mean standard errors (SEs) of the mistuning perception ability estimates, plotted as a function of test length. For panels A and B, the shaded ribbon represents the 95% confidence region

