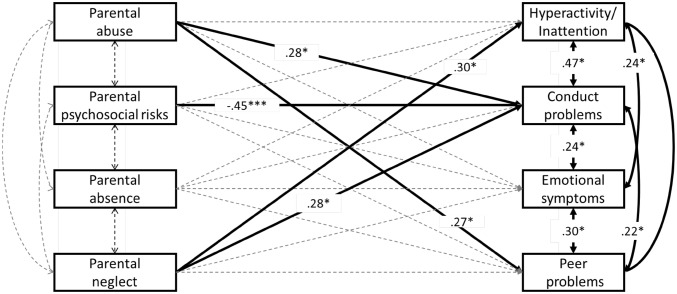
Fig. 3.
The multivariate path model showing associations between childhood adversity principal components and Strength and Difficulties Questionnaire subscales. All estimations controlled for gender and total time spent in care, adjusted for clustering at institution level, and boostrapped for 10,000 times. Full information maximum likelihood estimation (ML) was used to include cases with missing data on the independent variables. *p < .01; ** p < .05; *** p < .005. Significant associations are indicated in bold lines. p < .01; **p < .05; ***p < .005

