
Fig. 1.
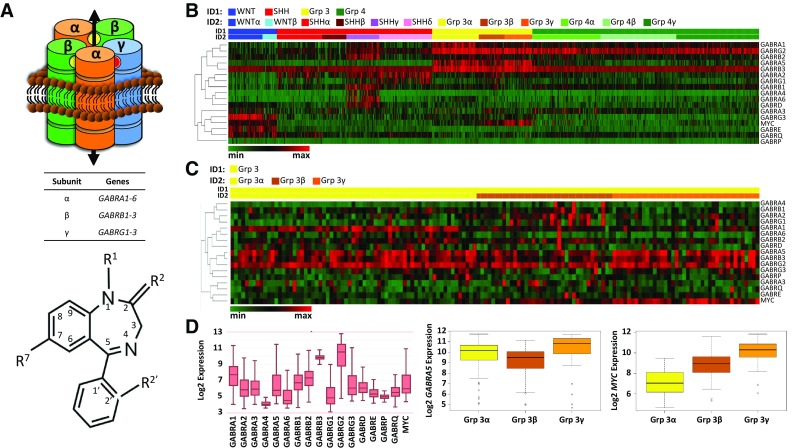
GABAA receptor subunit gene (GABR) and MYC expression across 763 primary medulloblastoma tumors. a Top, GABAA receptor (GABAAR), αβαβɣ subunit stoichiometry, consists of five subunit transmembrane segments which create the chloride-anion conduction pore. Inter-subunit binding sites for GABA and benzodiazepine are shown as yellow and red spheres, respectively. Bottom, common core structure of a ‘benzodiazepine’. Indicated are sites frequently modified (R1, R2, R2′, R7), which may impart a GABAAR subtype-preference. Introduction of an ethinyl bond at R7 imparts an α5-GABAAR preference. b Supervised heatmap clustering analysis across medulloblastoma molecular subgroups using z-score scaling, 1-Pearson correlation distance, and average clustering. The relationship between genes is indicated by the dendrogram (left). Shown bottom, left is a color palette where color scaling indicates low (green) to high (red) expression. Samples were classified into four subgroups (ID1) and further into twelve subtypes (ID2). c Supervised heatmap clustering analysis of group 3 only using z-score scaling, 1-Pearson correlation distance, and complete clustering. Shown bottom, left is a color palette where color scaling indicates low (green) to high (red) expression. ID1: group 3, yellow; ID2 within group 3: α, yellow; β, brown; γ, orange. d Boxplots of GABR and MYC expression across subgroups (left) and separately GABRA5 (middle) and MYC (right) expression of group 3