
Fig. 4.
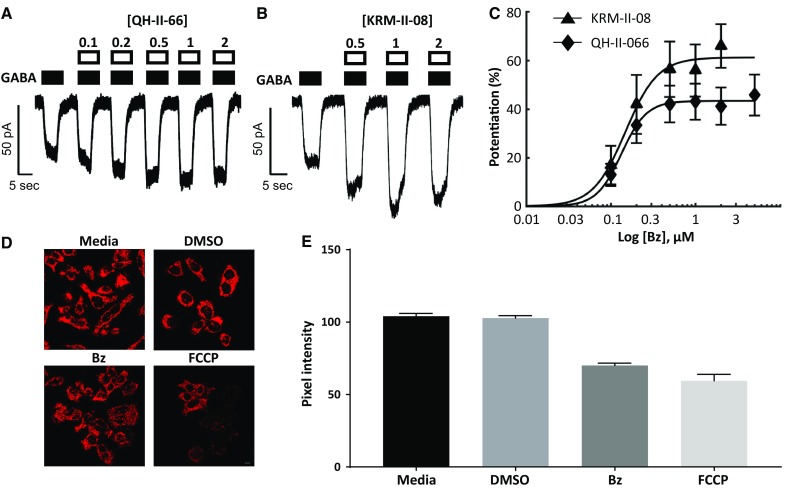
Early chemical and physiological response of group 3 medulloblastoma cells treated with α5-selective benzodiazepines. a, b D283 cells, clamped at − 60 mV, responses to GABA by α5-selective benzodiazepines QH-II-066 (a) and KRM-II-08 (b). Filled boxes above current trace denote duration of GABA application. Open boxes denote the period of benzodiazepine exposure and are labeled with the concentration applied. c Both QH-II-066 and KRM-II-08 (Bz) show enhanced submaximal (EC5–EC10) responses in a concentration-dependent manner: PC50: 43 ± 7 versus 61 ± 9, Hill slope 2.7 ± 5 versus 2.9 ± 5 and PC50 0.13 ± 0.09 versus 0.14 ± 0.07 µM, respectively. The effects of QH-II-066 and KRM-II-08 were not significantly different from one another (p > 0.05, Student’s t-test). d Fluorescence microscopy imaging of live D283 cells stained with tetramethylrhodamine ethyl ester (TMRE) following a 10-min treatment with dimethyl sulfoxide (DMSO; 0.125%), carbonyl cyanide 4-(trifluoromethoxy) phenylhydrazone (FCCP, 20 µM), or KRM-II-08 (Bz) (0.7 µM). Media alone had no DMSO. Peak: λex, 549 nm; λem, 575 nm. e Quantitation of TMRE staining with the Leica Application Suite X (LAS X) software platform. Data are presented as standard error from mean of thirty or more cells (media, n = 30; DMSO, n = 43; KRM, n = 39; FCCP, n = 35). Scale bar in panel (d) image for FCCP is 10 microns