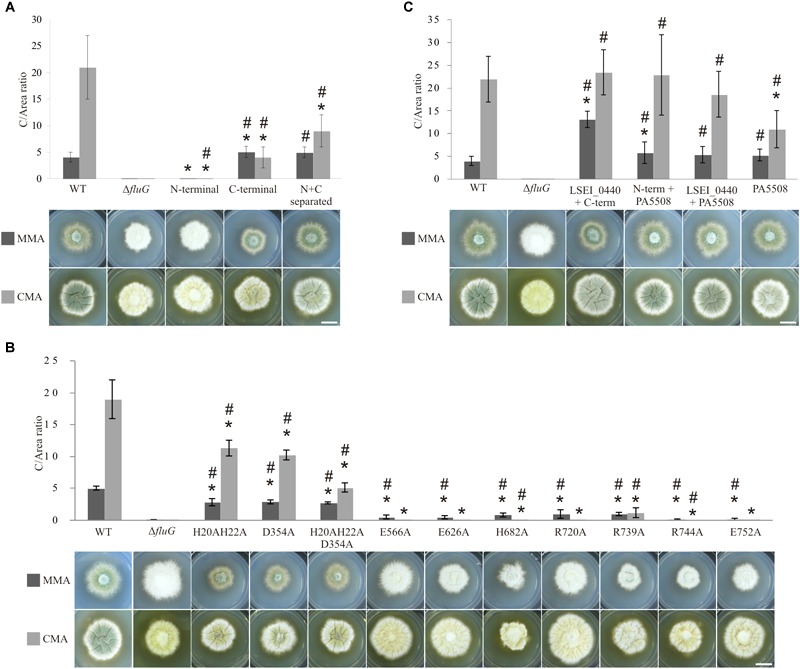
FIGURE 6.

Phenotypes and C/area (millions/cm2) ratios of all the FluG mutants. (A) Wild type (WT) along with fluG null (ΔfluG), N-terminal (aa1–aa406), C-terminal (aa427–aa865) regions and N- and C-terminal separated regions (N+C separated) mutants in MMA and CMA. (B) FluG point-mutations in both regions. (C) Heterologous substitutions, showing LSEI_0440+C-term (FluG), N-term (FluG)+PA5508, LSEI_0440+PA5508 and PA5508 only. Note that different scales were used in each panel to better represent the differences in C/area (millions/cm2) values. The C-values that are statistically different (P-value < 0.05) to the WT (∗) and the ΔfluG (#) are marked. Scale bar = 1 cm.
