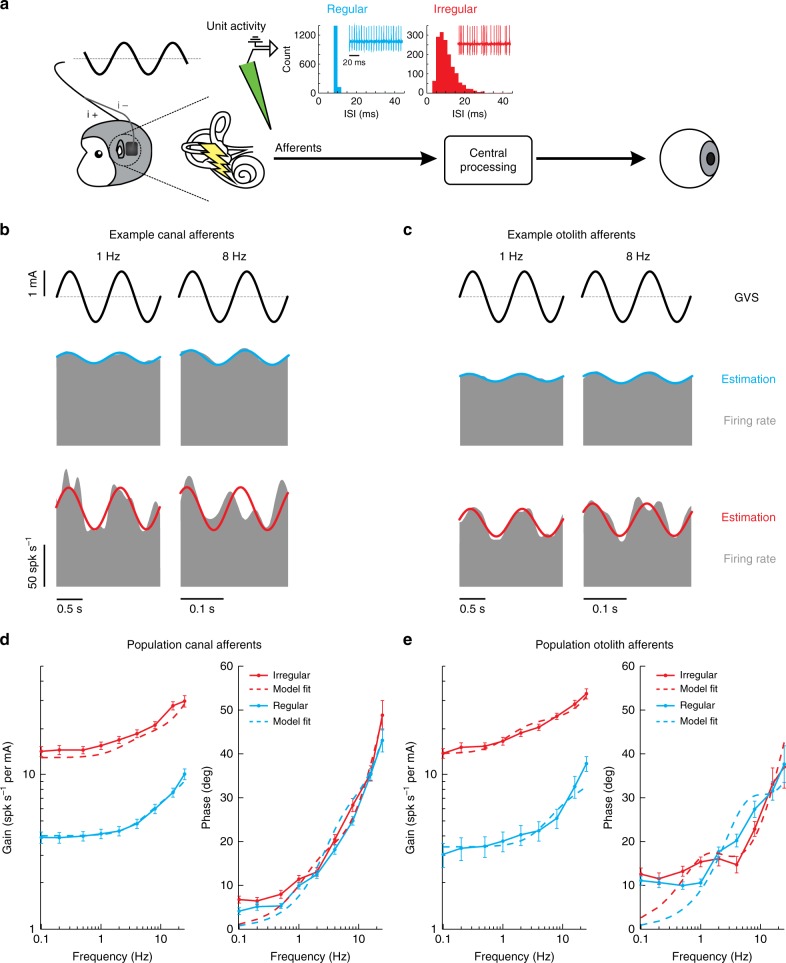
Fig. 2.
Response dynamics of vestibular afferents to sinusoidal GVS. a We recorded extracellular single-unit activity from vestibular afferents using tungsten electrodes during sinusoidal GVS. The insets show the interspike interval (ISI) histogram for the resting discharge of the example canal afferents. Regular afferents have a narrow ISI distribution whereas irregular afferents have a broader ISI distribution. b Firing rate (gray) of example regular (blue) and irregular (red) canal afferents to 1 Hz (left) and 8 Hz (right) sinusoidal GVS. Firing rate estimates (solid blue and red lines) were found using Eq. 1. c Firing rate (gray) of example regular (blue) and irregular (red) otolith afferents to 1 Hz (left) and 8 Hz (right) sinusoidal GVS. d Population averaged gain (left) and phase (right) of regular (blue) and irregular (red) canal afferents. Dashed lines depict the transfer function fits of response dynamics for regular and irregular canal afferent activity using Eq. 2. (regular: ; irregular: ). e Population averaged gain (left) and phase (right) of regular (blue) and irregular (red) otolith afferents. Dashed lines depict the transfer function fits of response dynamics for regular and irregular otolith afferent activity using Eq. 3, (regular: ; irregular: ). Error bars depict the s.e.m.

