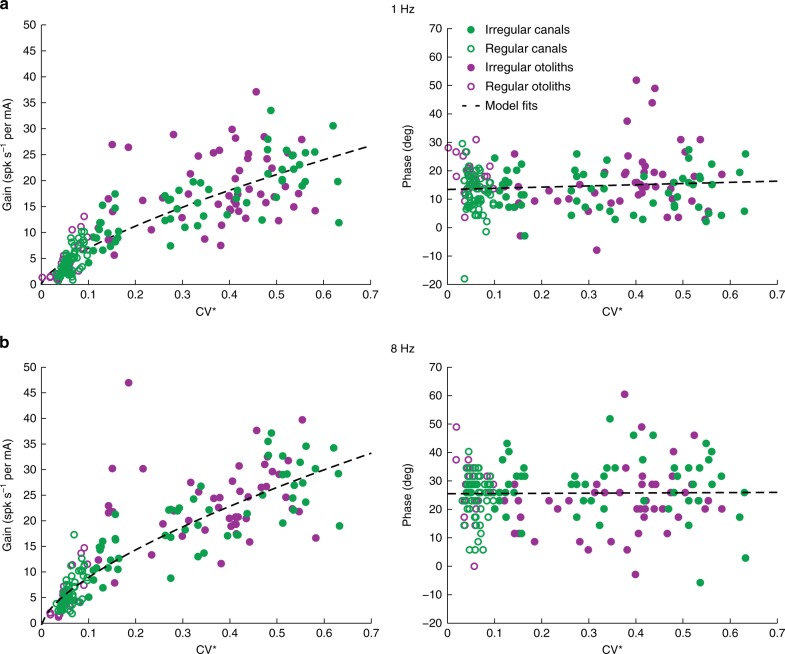
Fig. 3.
Comparison of canal and otoliths afferent responses to sinusoidal GVS. Gain (left) and phase (right) of canal (green circles, N = 119) and otolith (purple circles, N = 84) afferents to 1 Hz (a) and 8 Hz (b) sinusoidal stimulation as a function of the resting discharged variability, quantified as CV*. Dashed lines depict estimated power-law fits of gain (1 Hz: a = 30.2 [c.i. 27.1, 33.2], b = 0.64 [c.i. 0.6, 0.7]; 8 Hz: a = 41.3 [c.i. 37.7, 44.9], b = 0.62 [c.i. 0.6, 0.7]; left plots) and linear fits of phase (1 Hz: a = 9.7 [c.i. 4.8, 14.7], b = 9.7 [c.i. 8.3, 11.1]; 8 Hz: a = 0.7 [c.i. −7.2, 8.6], b = 25.5 [c.i. 23.2, 27.8]) to the combined canal and otolith afferent data set. c.i.: confidence interval

