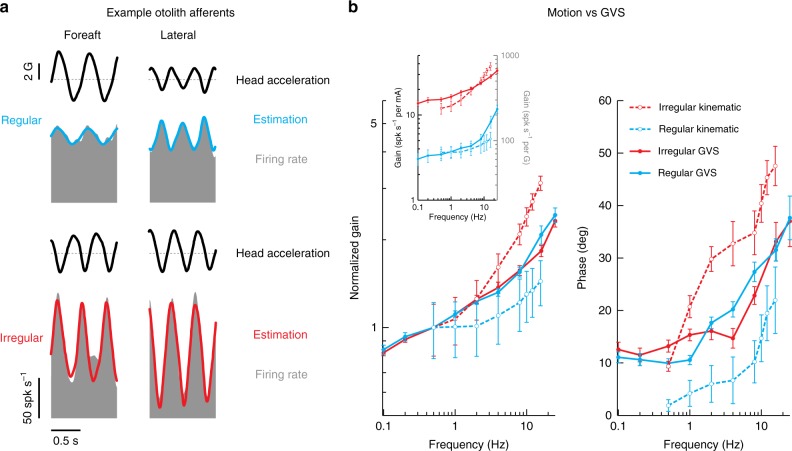
Fig. 5.
Comparison of motion and GVS for otolith afferents. a Firing rate (gray) of example regular (blue) and irregular (red) otolith afferents to ~2 Hz foreaft (left) and lateral (right) head acceleration. Firing rate estimates (solid blue and red line) are found using Eq. 5. The irregular otolith afferent was more sensitive to translation than the regular otolith afferent (2 Hz: 223.4 ± 31.2 spk s−1 per G versus 68.6 ± 17.3 spk s−1 per G). b Population-averaged neuronal gain (i.e., sensitivity) (left) and phase (right) for regular (blue) and irregular (red) otolith afferents as a function of the translation (dashed lines, from Jamali et al.46) and GVS (solid lines) stimulus frequency. Gain in the main plot was normalized to responses at 0.5 Hz for comparison of responses across stimulus type, while the inset shows the non-normalized gain plotted with stimulus specific units. Error bars depict the s.e.m.

