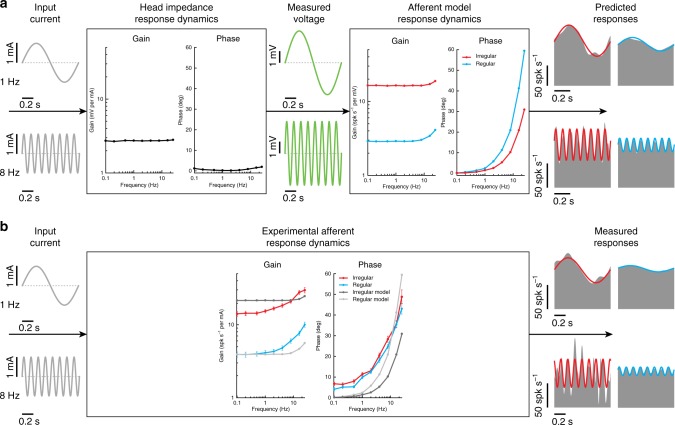
Fig. 6.
Simulation results of a vestibular afferent model to galvanic vestibular stimulation. a Current input (gray) produces voltage changes (green) in the tissue surrounding the afferent with a flat gain and phase at all frequencies (i.e., head impedance response dynamics—left box). These voltage changes were then used as input to the afferent model to produce the changes in afferent firing rate (gray) for example regular (blue) and irregular (red) afferents. The resultant afferent model response dynamics (right box) produce increasing gains and phases as a function of frequency for both afferent types. b Experimentally estimated canal afferent response dynamics as a result of a current input are replotted here for comparison to the simulated data. Similar to the experimental responses, simulated data produced frequency dependent changes in gain and phase. For illustrative purposes simulated gain results were normalized to regular canal afferent responses at 0.1 Hz

