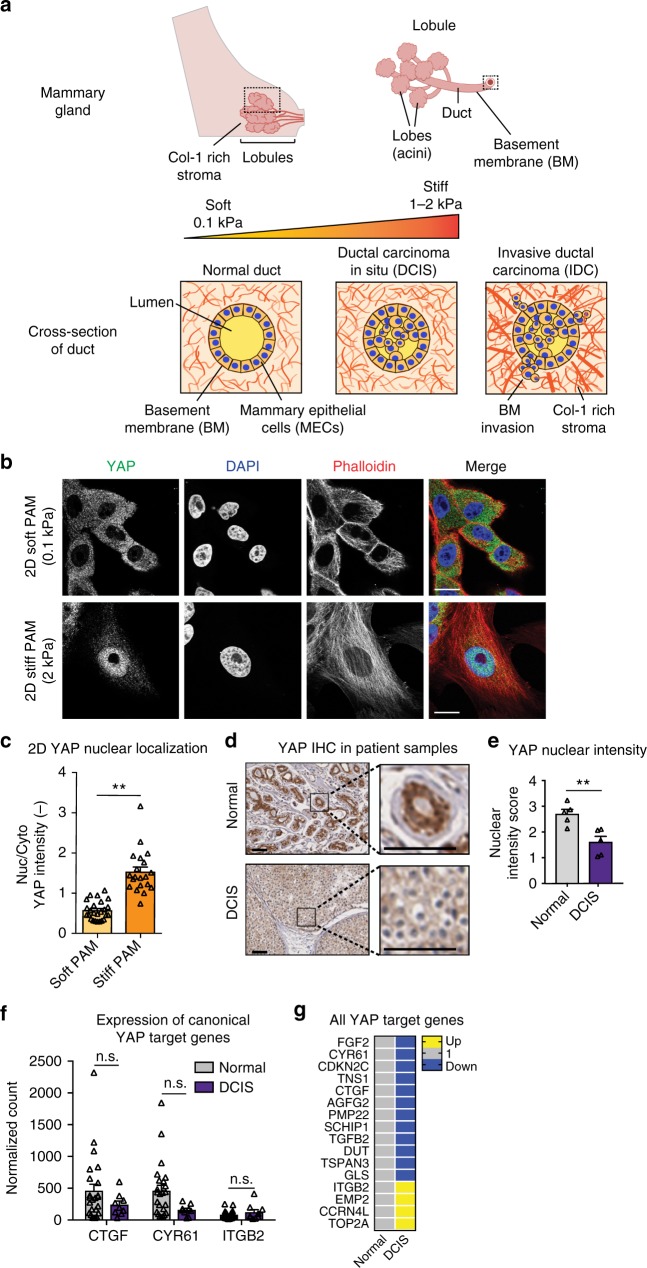
Fig. 1.
YAP is not activated during DCIS. a Schematic of ductal carcinoma progression. b MCF10A cells seeded on col-1-coated PAM gels. Bars: 10 µm. c YAP quantification from 2D gels. **p < 0.0001, one-way ANOVA followed by Tukey post hoc comparison tests, symbols represent each cell, n = 9–14 cells per hydrogel. d YAP staining in primary tissues. Bars: 50 µm. e Quantification of YAP IHC intensity. **p < 0.01, unpaired t test, symbols represent each patient sample, n = 5 normal and 5 DCIS patients. Expression of f canonical and g all YAP target genes in patient samples. n.s. not significant, one-way ANOVA followed by Tukey post hoc comparison tests, symbols represent each patient sample, n = 24 normal and 9 DCIS patients. All bar charts display mean ± SEM. All measurements were taken from distinct samples

