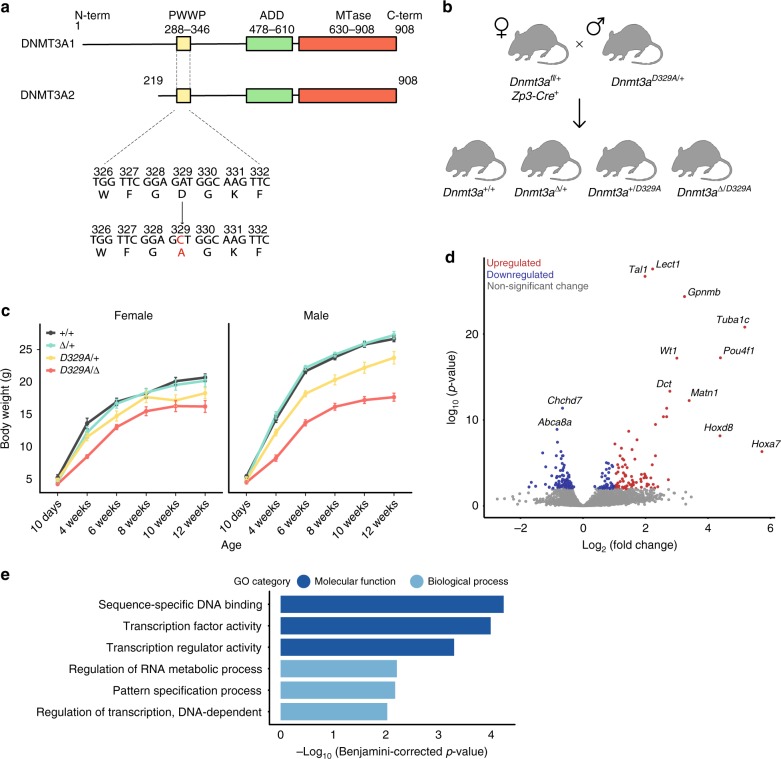
Fig. 1.
Phenotypic description of mice carrying the Dnmt3aD329A allele. a Schematic representation of the DNMT3A protein isoforms and location of the base substitution, coloured red, introduced to generate the D329A mutation. NCBI IDs: CCDS36397.1, CCDS25784.1. Known domains are indicated by coloured boxes, based on the PROSITE database; numbers indicate amino acid residues. b Breeding scheme used to generate offspring of four different genotypes. +; wild-type allele; fl: Dnmt3a containing loxP sites surrounding exon 18; Δ: loxP sites after recombination leading to deletion of exon 18; Zp3-Cre: oocyte-specific Zp3 promoter-driven Cre recombinase21,22; D329A: a Dnmt3a allele point missense mutation in exon 8. c Growth curves indicating change in body weight of male and female mice of different genotypes over the indicated post-natal weeks. Mixed model ANOVA (KR-method) shows overall significant change dependent on genotype and time in both sexes (p < 0.001, df(males) = 15,229.48, df(females) = 15,142.15), F = 0). Subsequent pairwise Bonferroni-adjusted t-test comparisons show that Dnmt3aΔ/D329A males become significantly underweight at week 4 (p < 0.001), and Dnmt3a+/D329A at week 6 (p < 0.001). Dnmt3aΔ/D392A females become significantly underweight starting from week 4 (p = 0.002), with the exception of week 8 (p = 0.095). Dnmt3a+/D329A females do not show significant change. n values are given in Supplementary Table 3. Error bars indicate standard error of the mean. Raw data are provided in Source Data. d Volcano plot showing gene expression fold change and its significance between Dnmt3a+/+ and Dnmt3aΔ/D329A adult (14-week) hypothalamus. Differentially expressed genes were determined using DEseq (p < 0.01, Benjamini–Hochberg multiple comparisons correction). n(+/+) = 5, n(Δ/D392A) = 4. Selected genes showing the most significant and highest fold change are named. e Gene ontology (GO) analysis of differentially expressed genes; only significant terms are shown. Benjamini–Hochberg corrected p-value < 0.1 was used as a threshold

