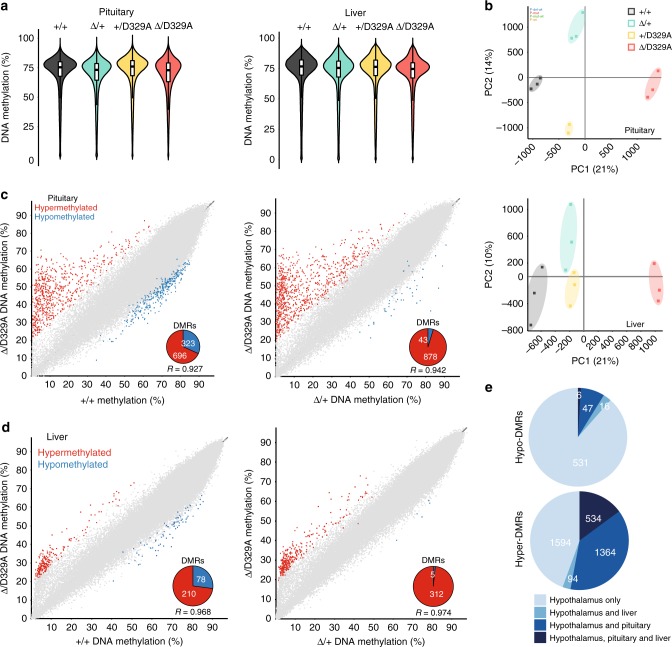
Fig. 3.
DNA methylation in adult pituitary and liver. a Beanplots indicating whole genome methylation levels in pituitary and liver of 14-week adult male mice carrying the alleles shown. Tiles of 300 CpG positions. Boxplot shows median value and 25–75th percentiles, whiskers show lowest and highest observation, excluding outliers. Raw data are provided in Source Data. b PCA plots showing clustering of individual pituitary and liver samples into separate distant groups based on the genotype. c, d Scatterplots showing correlation between methylation levels of individual 300-CpG tiles in 14-week adult male (c) pituitary and (d) liver between Dnmt3a+/+ and Dnmt3aΔ/D329A, and between Dnmt3aΔ/+ and Dnmt3aΔ/D329A. Differentially methylated tiles were determined using the EdgeR proportion statistic in SeqMonk (p < 0.01 corrected for multiple comparisons using Benjamini–Hochberg, methylation difference ≥ 20%). Pie-chart insets indicate how many of DMRs are hyper-methylated or hypo-methylated. e Pie charts showing how many hypo-methylated and hyper-methylated tiles in hypothalamus overlap the corresponding differentially methylated tiles in pituitary, liver or both. Pituitary and liver: tiles of 300-CpG position; hypothalamus: tiles of 100-CpG positions. In a–d, n(pituitary, +/+, Δ/+, Δ/D329A) = 3, n(pituitary, +/D329A) = 2, n(liver) = 3

