Fig. 4.
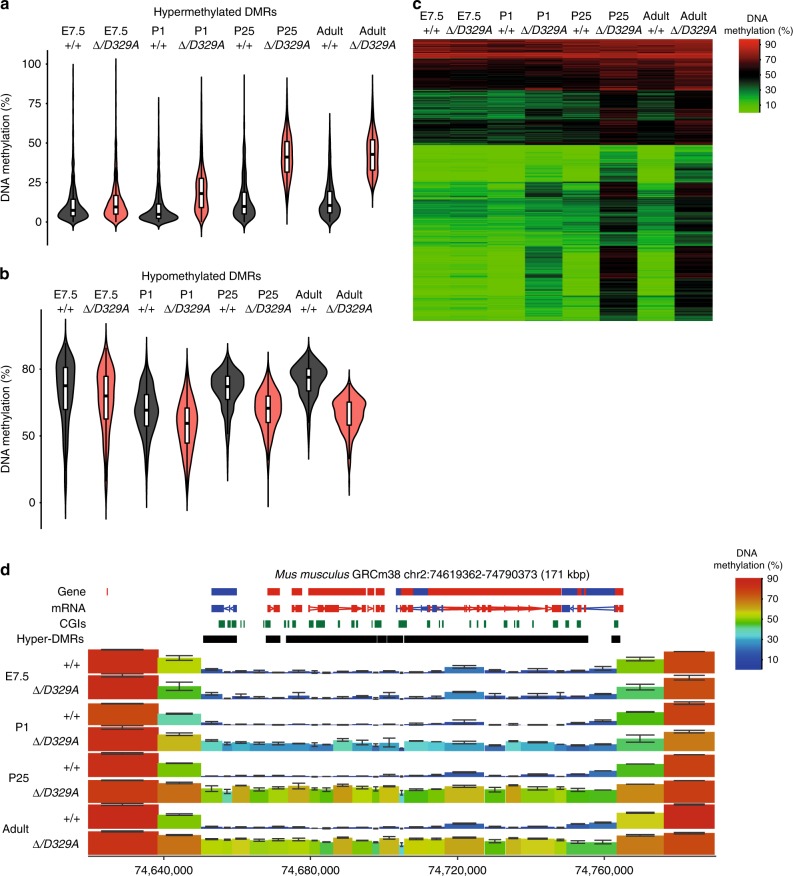
DNA methylation dynamics during development. a, b Beanplots indicating DNA methylation levels over hyper-methylated (a) and hypo-methylated (b) DMRs across development in Dnmt3a+/+ and Dnmt3aΔ/D329A mice. Tiles were quantified over adult hypothalamus DMRs, which were merged if the distance was <1 kb. Boxplots show median value and 25–75th percentiles, whiskers show lowest and highest observation, excluding outliers. Raw data are provided in Source Data. c Heatmap showing how methylation is gained at DMRs over time. Shown are 1915 300-CpG tiles, overlapping DMRs identified between Dnmt3a+/+ and Dnmt3aΔ/D329A in adult (14-week) hypothalamus. DMRs are clustered based on Euclidean method, on the basis of smallest absolute difference between quantitation values. Tiles of 300-CpGs. d Genome browser view of the Hoxd gene cluster indicating progressive gain in DNA methylation across the whole domain. For gene and mRNA tracks, the colour indicates direction, where red is a forward strand and blue is a reverse strand. CGI: CpG island, hyper-DMR: hypermethylated region identified in adult hypothalamus. Colour-coded blocks indicate tiles of 300-CpG positions. Error bars indicate standard deviation. In a–d, E7.5 is epiblast, and P1, P25 and adult are hypothalamus. n(E7.5) = 4, n(P1, P25) = 2, n(adult) = 3

