Fig. 8.
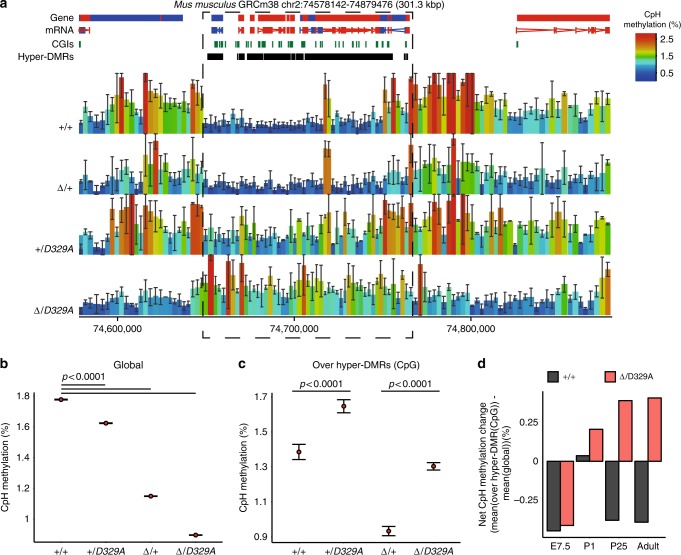
CpH methylation in hypothalamus of Dnmt3a+/+ and Dnmt3aΔ/D329A mice. a Representative genome browser view of CpH methylation in adult (14-week) male hypothalamus. Methylation levels appear to be dependent on the number of alleles present, with a decrease observed in Dnmt3a∆/+ compared to Dnmt3a+/+. Notably, there is an increase of methylation over hyper-DMR regions (highlighted by the box) in the presence of Dnmt3aD329A. Each bar represents a 1000-CpH tile. For gene and mRNA tracks, the colour indicates direction, where red is a forward strand and blue is a reverse strand. CGI: CpG island, hyper-DMR: hypermethylated region. n(+/+, Δ/+, Δ/D329A) = 3, n(+/D329A) = 2. Error bars indicate standard deviation. b Global mean CpH methylation values across different genotypes. c Mean CpH methylation values over DMRs with CpG hypermethylation. b, c 1000-CpH tile quantitation for chromosomes 2 and 11 was used as representative. Error bars indicate standard error of the mean. Pairwise comparisons were done using a two-tailed t-test. Raw data are provided in Source Data. d Barplot indicating the net difference in mean CpH methylation between hyper-DMRs and global levels for Dnmt3a+/+ and Dnmt3a Δ/D329A mice across development (E7.5 epiblast, P1, P25, and adult hypothalamus). Raw data are provided in Source Data

