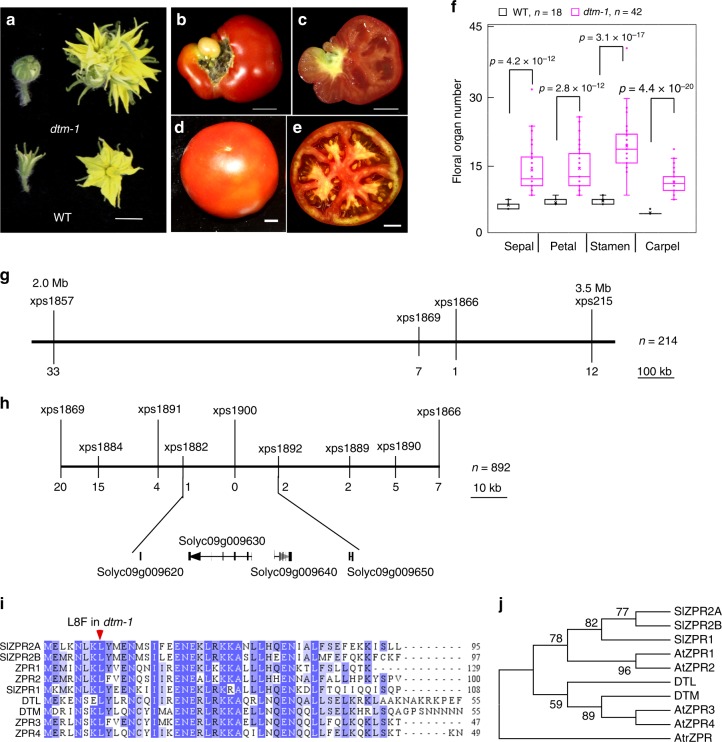
Fig. 1.
Isolation of the DTM gene. a–e images of flower buds and flowers at anthesis (a) and fruits (b–e) from dtm-1 (a–c) and wild type (a, d, and e) plants in the LA2397 background. Images of longitudinally sectioned dtm-1 fruits (c) showed that no seeds formed inside, compared with seeded wild type fruits (e). Scale bars, 1 cm. f floral organ number of dtm-1 and wild type. Data were collected from flowers at anthesis from 10 plants per genotype. The boxplots show the first quartile and third quartiles, split by the median. Means are indicated by an X in each box. A Welch’s t-test was applied to compare the differences in means between dtm-1 and wild type. g low resolution mapping of the DTM locus. DTM was mapped to a 1.5 Mb interval using 214 dtm-1 plants from a S. pimpinellifolium LA1781 × dtm-1 F2 population. h fine mapping of DTM. The DTM locus was further narrowed down to a 25.3 kb region between the xps1882 and xps1892 markers using a total of 892 mutants. The numbers under the lines marking the genetic markers are the numbers of recombinants. i protein sequence alignment of DTM and its homologs in tomato and Arabidopsis thaliana. The missense mutation identified in dtm-1 is indicated by a red arrowhead. j maximum parsimony tree of DTM and its homologs in tomato and A. thaliana. The consensus phylogenetic tree was constructed using MEGA7.0 with 1000 bootstrap replications and the tree was rooted by an outgroup ZPR protein, AtrZPR (NCBI accession: XP 006851800.1), from Amborella trichopoda. The numbers next to branches show the percentages of the replicate trees (only 50% or higher reported) in the bootstrap test

